Order flow trading, 2026
Order flow shows which side traded, at which price, and what is still waiting in the book. Three tools do the work: delta, the DOM and the footprint chart.
Definitions of delta, bid and ask volume, dominant side and market depth from Sierra Chart’s documentation. Phidias data rules from our own rules page. Read on October 23, 2026.
Order flow trading reads the trades and the resting orders that move price, not just the candle they leave. Its three tools are delta (volume at the ask minus volume at the bid), the DOM (the ladder of resting orders) and the footprint chart (bid and ask volume at every price). It is mostly used on futures such as NQ and ES, where trades are published by the exchange.
In short
- Delta: ask volume minus bid volume, at one price or over a period.
- Footprint chart: each candle shows the bid and ask volume traded at every price inside it. It needs only the best bid and ask, not market depth.
- DOM: the ladder of resting buy and sell orders near the price. It does need market depth data.
- Why futures: trades are published by the exchange, and Sierra Chart says a bid or ask flag from the exchange or data feed is the most accurate way to tag each one.
- At Phidias: DeepCharts gives you Deep Candles (footprint), a DOM ladder and volume profile, and the setup guide says Windows desktop access is free with an evaluation or funded account on the DeepCharts data feed.
- Account fit: Express to Live has a static drawdown, no consistency rule and no daily loss limit.
What is order flow trading?
A candle tells you where price went. Order flow tells you how it got there. It looks at two kinds of information:
- Executed trades: how many contracts changed hands at the bid and at the ask. This is what delta and the footprint chart summarise.
- Resting orders: the buy and sell limit orders waiting near the current price. This is what the DOM shows.
The two answer different questions. Trades confirm what already happened. Resting orders show what might happen, since an order sitting in the book can be cancelled before it trades.
Order flow is often added to a plan the trader already has, as a way to confirm a level or an entry. It is not a strategy on its own.
What does delta mean in order flow?
Delta is the volume traded at the ask minus the volume traded at the bid. Sierra Chart defines it as the difference between Ask Volume and Bid Volume at a price level or over a period of time, and counts volume in contracts, not in number of trades.
A trade at the ask is a buyer paying the offer. A trade at the bid is a seller hitting it. Here is a small example, with illustrative numbers, not market data:
The bar’s delta is 87 minus 105, or -18. Cumulative delta is simply the running total of these bar deltas. A common reading is that if price rises while delta falls, aggressive buyers may not be driving the move. It is a clue to check against the trades and the level, not a signal.
How do you read the DOM (depth of market)?
The DOM is a ladder of prices with the resting buy and sell limit orders next to each one. Sierra Chart describes market depth data as the quantities of buy and sell limit orders currently in the market at nearby price levels, usually 5 to 20 levels deep.
Traders use it for two things:
- Reading liquidity: where a lot of size is waiting above or below the price.
- Executing: placing and moving orders from the ladder with one click. DeepCharts lists it as DOM Ladder Trading, with real-time bid and ask visualization.
Caution: what you see is intent, not a trade. Large orders can appear and vanish, so confirm with the trades before you act on them.
What is a footprint chart?
A footprint chart opens each candle and shows the volume traded at the bid and at the ask on every price level inside it. Sierra Chart calls its version Numbers Bars and notes that it is also known as Footprint in other charting programs.
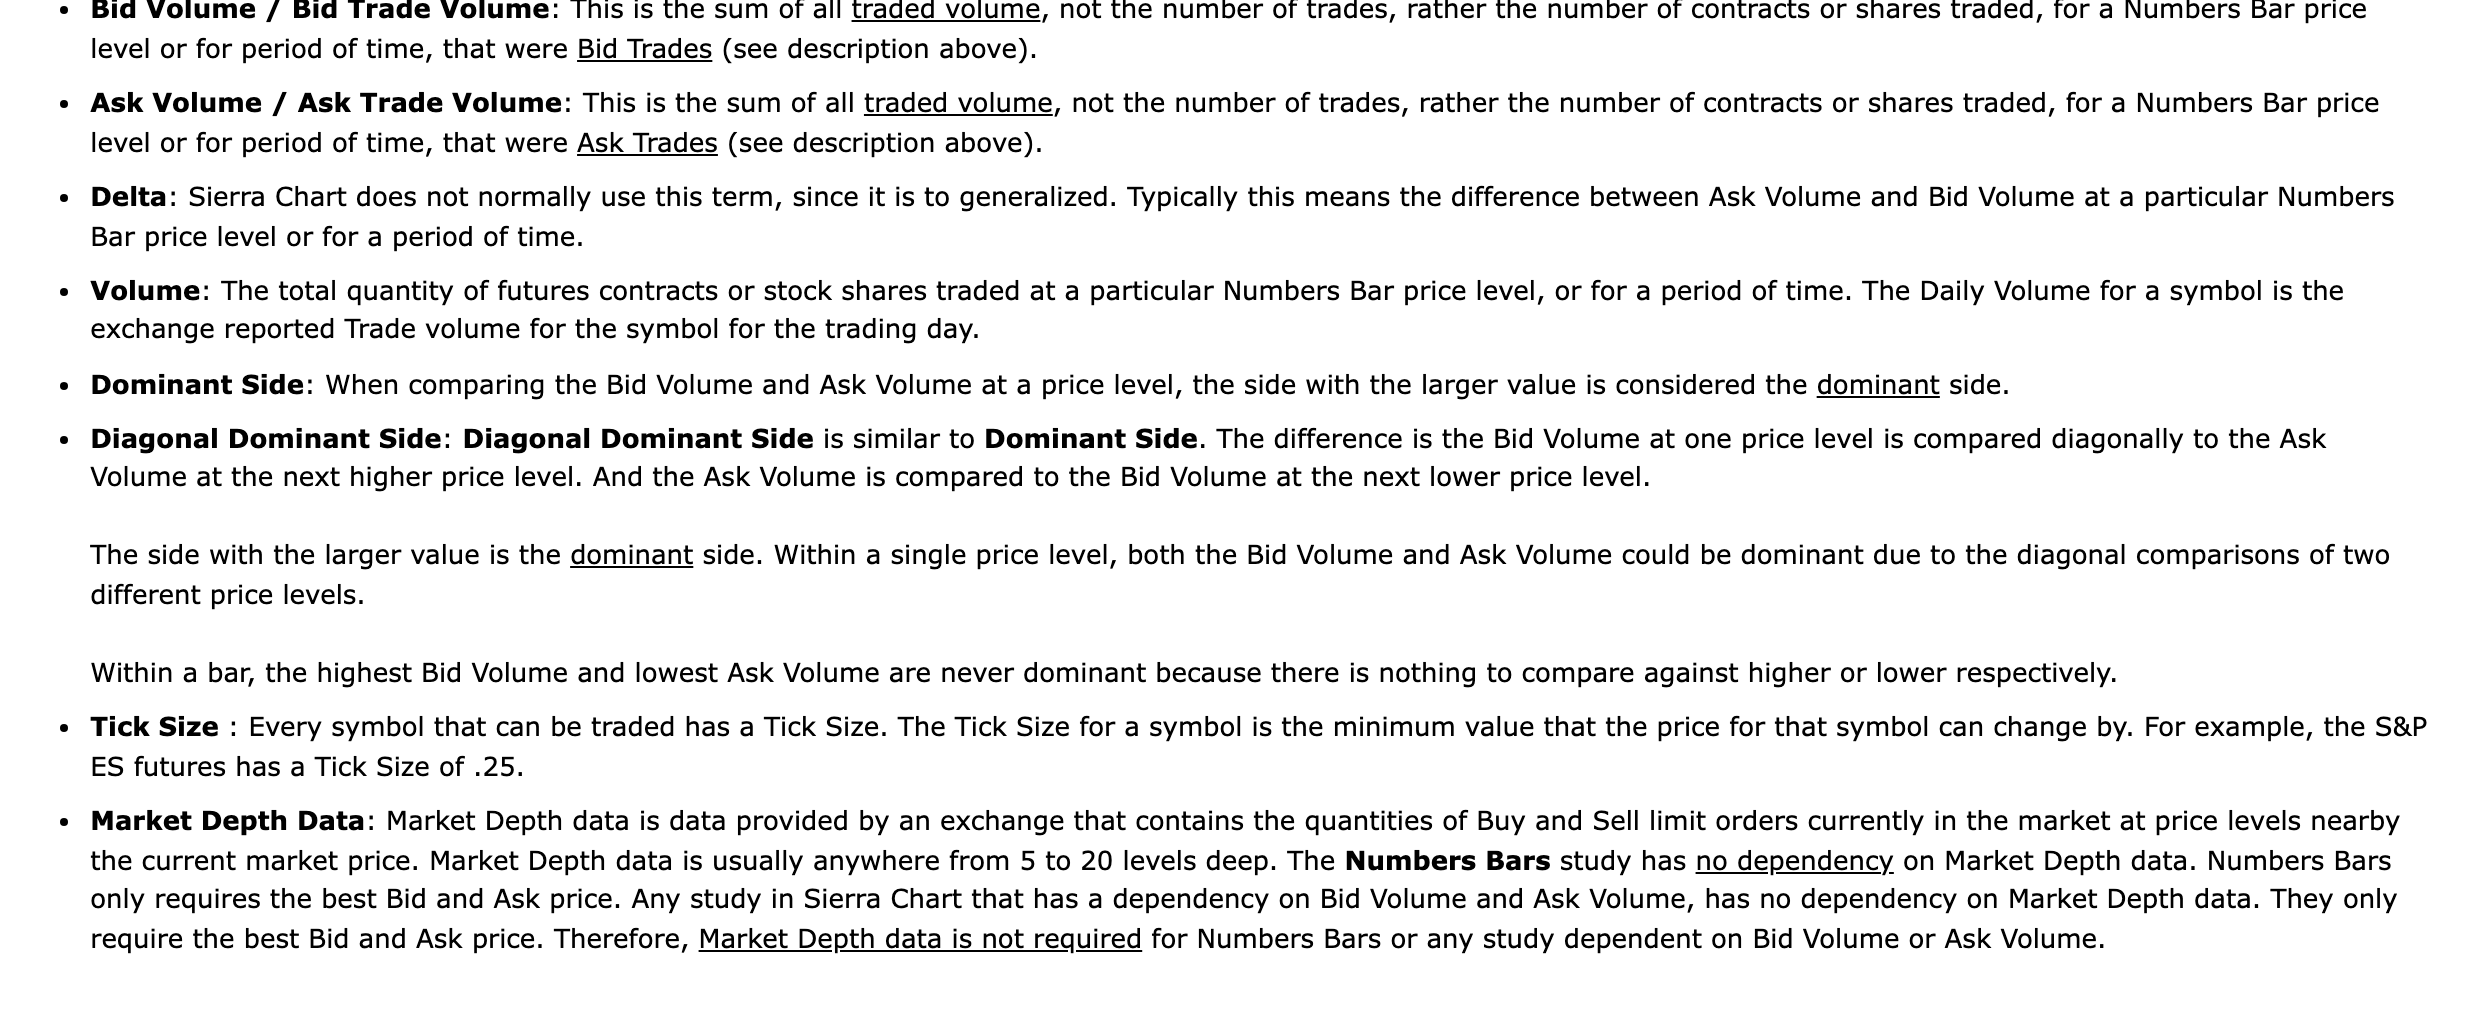
Two ideas make footprint readable:
- Dominant side: at a price level, the side (bid or ask) with the larger volume.
- Diagonal comparison: Sierra Chart compares the bid volume at one level with the ask volume at the next level up, and the ask with the bid at the level below. Traders call a lopsided diagonal an imbalance.
Absorption, imbalances and delta divergence
These are the three patterns traders look for. None of them is a signal on its own, so treat each as context for a trade you already planned:
- Absorption: heavy volume at a price while the price barely moves, which suggests the other side is absorbing the orders.
- Imbalance: one side clearly dominating the diagonal comparison, which suggests pressure in that direction.
- Delta divergence: price makes a new high or low while delta does not confirm it.
Why order flow is used on futures like NQ and ES
Order flow needs trades that are reported reliably, and futures trade on exchanges that publish them. In its documentation, Sierra Chart says that when the exchange or data feed flags whether a trade hit the bid or the ask, as with CME Group data in its own feed, that is the most accurate way to assign the side, and it describes the method as 100% accurate.
When a feed does not provide that flag, the platform has to infer the side from price and the last tick, and Sierra Chart names CQG as a feed that does not use the exchange flag. That is why the quality of your data feed matters as much as the chart, so check what yours provides. Sierra Chart also says the daily volume it shows is the exchange-reported trade volume.
Sierra Chart’s example gives ES a tick size of .25, the minimum price move. NQ and ES are the first CME instruments our DeepCharts page lists.
What market data do you need for order flow?
It depends on the tool. Delta and footprint need trades and the best bid and ask. The DOM needs market depth. Sierra Chart recommends 1-tick intraday data for footprint, because coarser data makes the numbers less accurate.
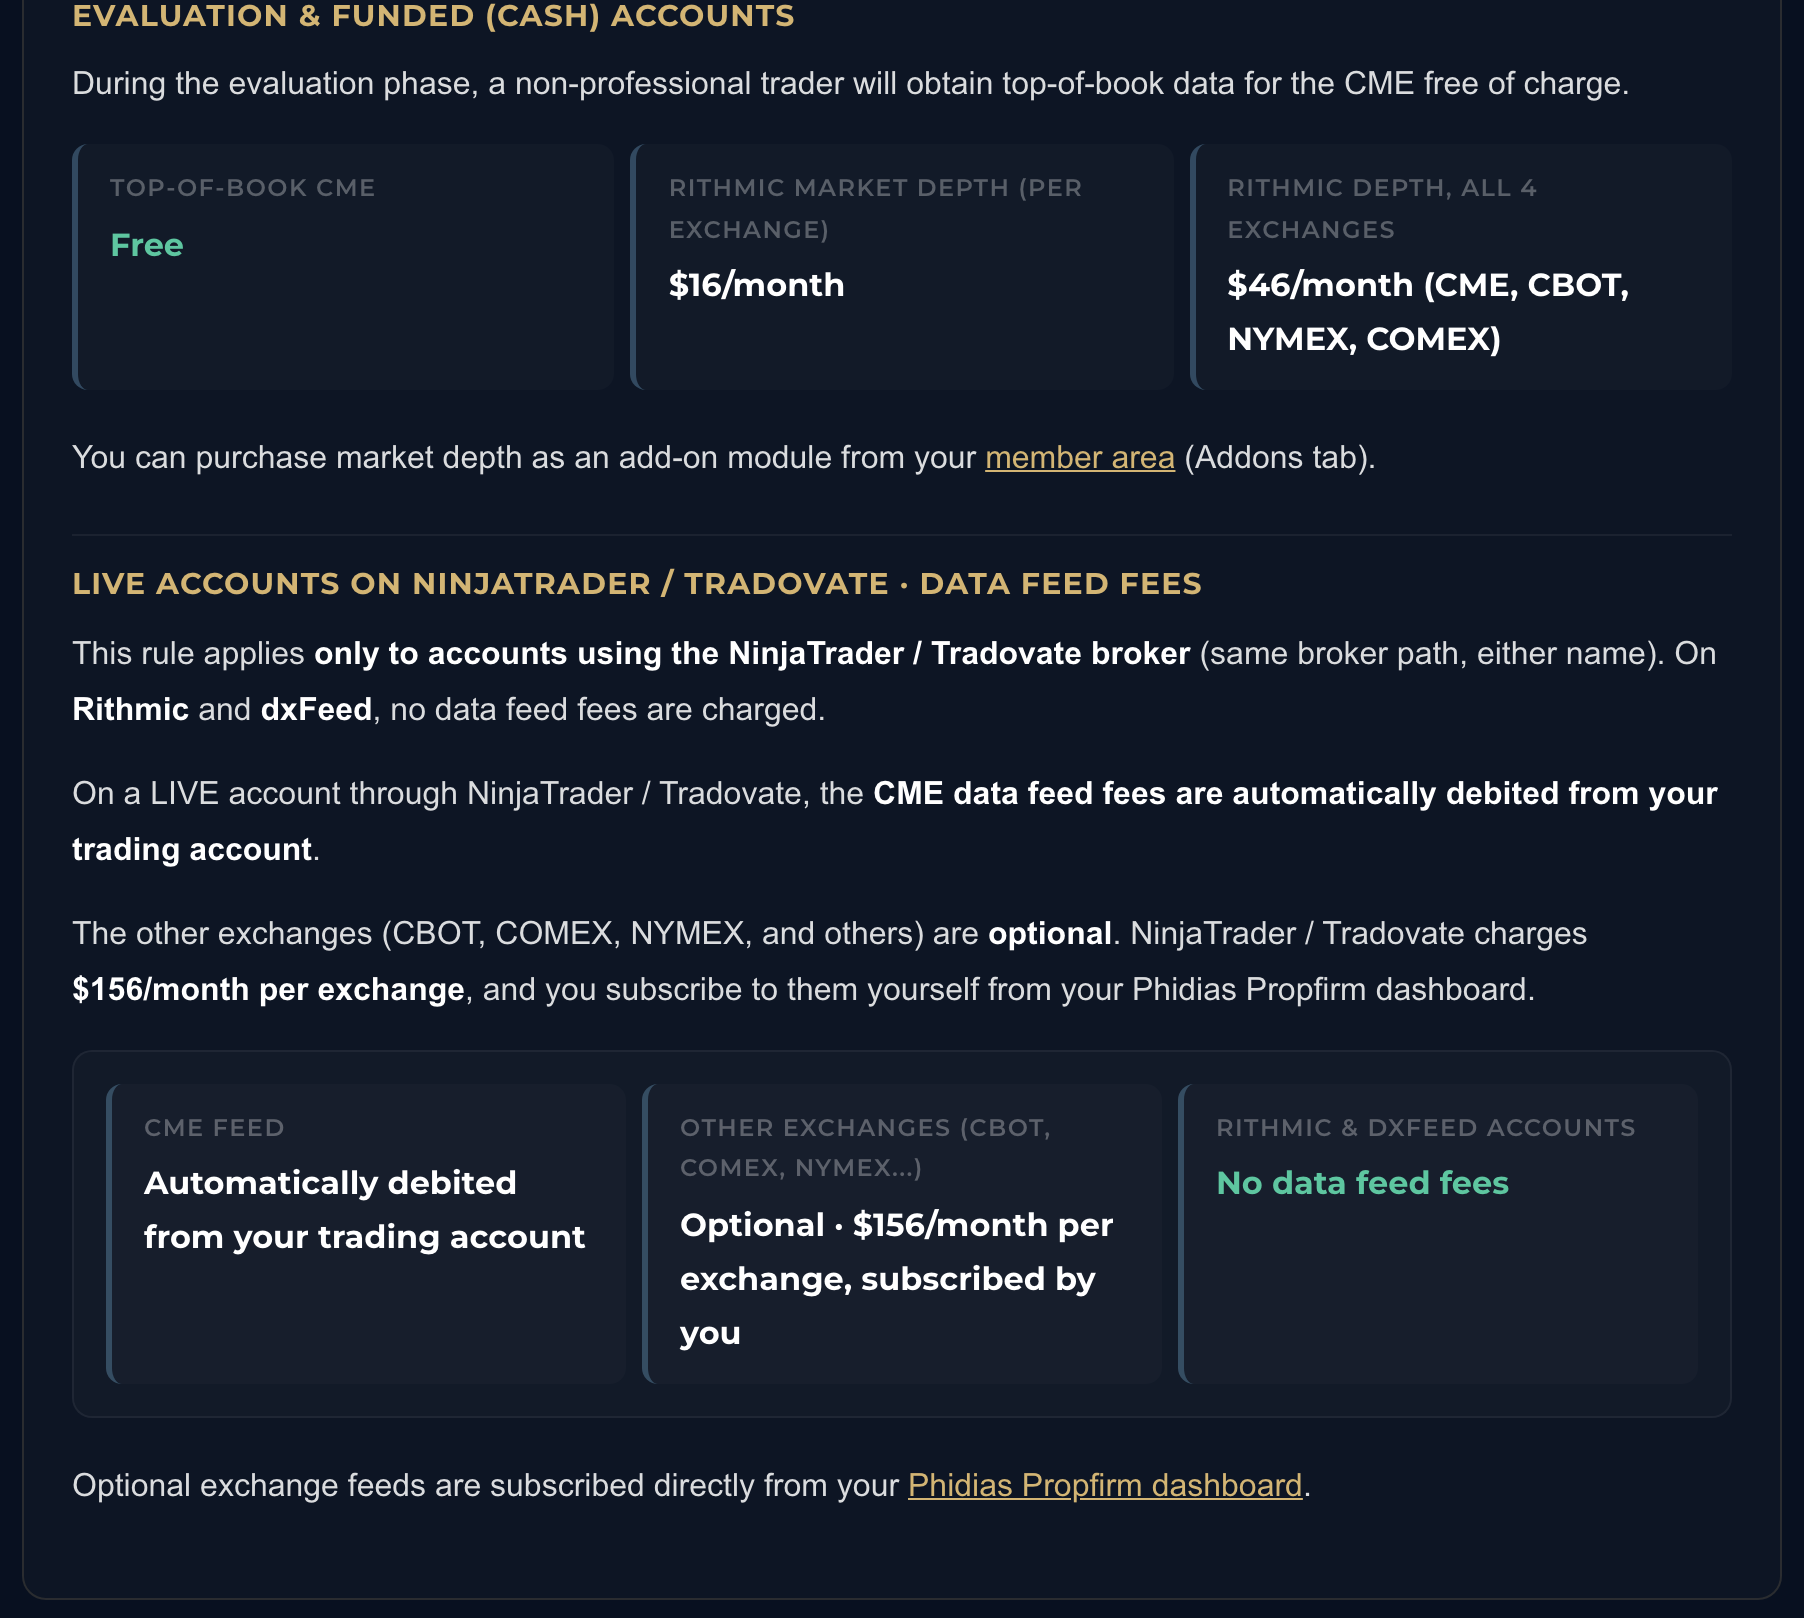
One scope note from our rules page: the LIVE-account data feed fees apply only to the NinjaTrader or Tradovate route. There, the CME feed fees are debited from the trading account, and other exchanges are optional at $156 a month per exchange, which is NinjaTrader and Tradovate’s charge, not ours. On Rithmic and dxFeed, no data feed fees are charged. The market depth add-on above is a separate, optional purchase.
Which platform for order flow at Phidias?
Phidias lists three platform paths: DeepCharts with dxFeed, any platform compatible with Rithmic, and NinjaTrader or Tradovate. For order flow, two stand out.
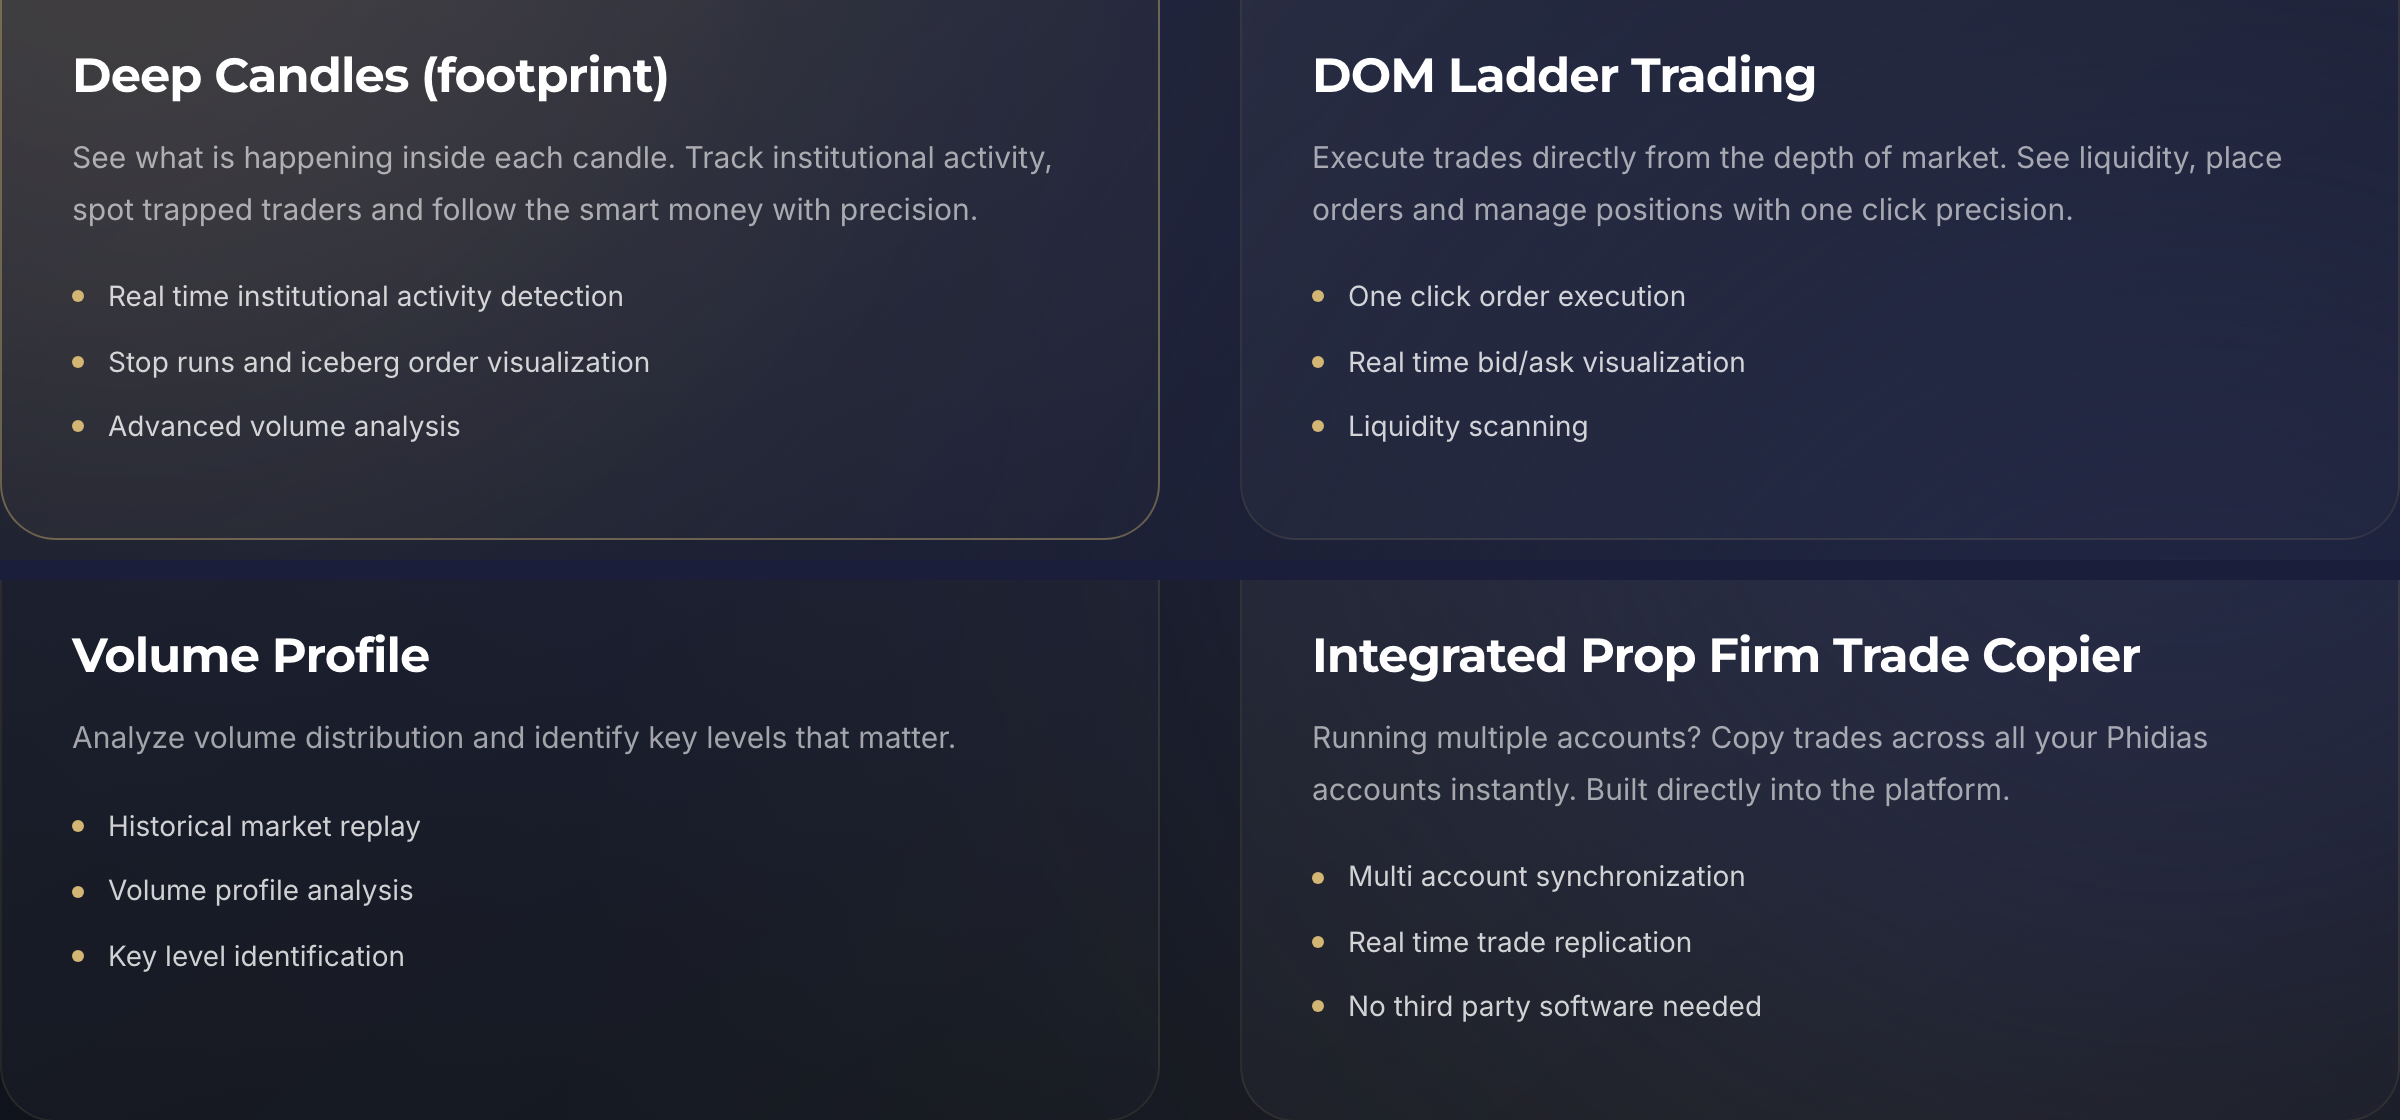
DeepCharts is built for order flow and data-driven traders. It runs in a browser and on desktop, and Phidias lists Deep Candles (footprint), a DOM ladder, volume profile, 80+ indicators and a built-in trade copier. Our DeepCharts desktop setup guide says desktop access is free with an evaluation or funded account that uses the DeepCharts data feed. The 15-minute delayed feed is for practice only, so select the real-time DX feed for live order flow, and note that the desktop version runs on Windows.
Sierra Chart has a footprint study (Numbers Bars), and it is the platform Phidias publishes free templates for: a starter chartbook with a footprint chart, and an intermediary one with a DoM, a footprint chart and a market profile, all with volume profile and value areas. They are on our platform templates page.
For a wider comparison, see our guide to futures trading platforms.
Get an Express to Live account
Can you trade order flow on a prop firm account?
Yes, and the account rules decide how well it fits. Footprint charts are often used for scalping, which means many small trades, so the account’s drawdown and size limits matter. On Express to Live:
- Static drawdown: it never trails, so a good day does not move your floor.
- No consistency rule, no daily loss limit, no minimum trading days.
- News trading allowed at every stage.
- Size is capped: 2 E-mini or 20 micro on the 25K, up to 9 E-mini or 90 micro on the 150K.
Positions must be closed before the end of the trading day. Your first payout converts the account to LIVE, and the full cycle can run in a single day: our record from purchase to payout is 6 hours 18 minutes, and 90% of payouts are processed in under 30 minutes. Bought as a one-time payment, the 25K goes from $277 to $69 with code PHIDIAS. Every rule is on our rules page.
A practical tip: with a $500 drawdown, micro contracts let you size to the stop you actually see on the footprint, instead of being forced into a full E-mini.
Test: which order flow tool should you learn first?
Three questions on how you trade. No email.
30 second check
Which order flow tool should you learn first?
Order flow trading 2026: frequently asked questions
What is order flow trading?
Order flow trading reads the trades and the resting orders that move price, instead of only the candle they leave behind. Traders use three main tools: delta (buy volume minus sell volume), the DOM (the ladder of resting orders) and footprint charts (volume at every price inside each bar). It is mostly used on futures such as NQ and ES, where the exchange publishes every trade and your platform and data feed decide how reliably each one is tagged bid or ask.
What does delta mean in order flow?
Delta is the difference between the volume traded at the ask and the volume traded at the bid, either at one price level or over a period of time. Positive delta means more contracts traded at the ask, negative delta more at the bid. Sierra Chart notes that it does not normally use the word, but defines it this way.
What is a footprint chart?
A footprint chart replaces each candle with the volume traded at the bid and at the ask on every price level inside it. Sierra Chart calls its version Numbers Bars and says it is also known as Footprint in other platforms. At Phidias, DeepCharts offers it as Deep Candles.
Do you need Level 2 market depth for a footprint chart?
No. Sierra Chart’s documentation says Numbers Bars only needs the best bid and ask price, plus tick-by-tick data for accuracy, and has no dependency on market depth. Market depth is what a DOM ladder displays, so you need it for the DOM but not for delta or footprint.
Is order flow trading profitable?
No tool makes a strategy profitable by itself. Delta, the DOM and footprint charts show what happened and what is resting in the book, not what comes next. Practice on a simulated or evaluation account before you size up, and keep your risk inside the rules of your account.
Which Phidias platform has footprint charts and a DOM?
DeepCharts, which Phidias lists with Deep Candles (footprint), a DOM ladder, volume profile and a built-in trade copier. Any platform compatible with Rithmic can be used, so check that it has footprint and DOM tools. Phidias also publishes free Sierra Chart templates that include a footprint chart and a DoM.
Does DeepCharts cost extra at Phidias?
Phidias’s DeepCharts setup guide says you get free access to the desktop version with an evaluation or funded account, with no separate subscription. Check the data feed shown at checkout for your account, because the guide applies to accounts that use the DeepCharts data feed.
How much does market depth cost at Phidias?
During the evaluation, top-of-book CME data is free for a non-professional trader. On Rithmic, market depth is an add-on at $16 a month per exchange, or $46 a month for all four exchanges (CME, CBOT, NYMEX, COMEX), bought from the Addons tab of your member area. The data feed fees in our LIVE-account rules apply only to the NinjaTrader / Tradovate route: on Rithmic and dxFeed, none are charged.
Can I trade order flow on an Express to Live account?
Yes. Express to Live has a static drawdown that never trails, no consistency rule, no daily loss limit, no minimum trading days and allows news trading. The 25K account has a $500 drawdown, a $1,500 profit target and a 2 E-mini maximum, so size is the constraint to plan around.
Related guides
Read it yourself
The verdict
“Order flow is worth learning because it makes you ask better questions about a level, not because it predicts anything. Start with footprint and delta, which need the least data, add the DOM when you trade size, and practise on an account where a mistake costs you a small, fixed drawdown.”
William G., CMO at Phidias Propfirm
William G., CMO at Phidias Propfirm, works on futures prop trading rules and payouts every day. Last reviewed 2026.
Definitions as documented by Sierra Chart and rules as published by Phidias in October 2026. Prop firms change their rules often: check the official pages before you buy. Trading futures involves substantial risk of loss. This article is educational and is not trading advice.