Futures day trading, 2026
We computed VWAP and anchored VWAP on real NQ and ES data. When NQ touched a 2 sigma band after 11:30 AM, it came back to VWAP before the close in only 44% of sessions.
Definitions from CQG and Sierra Chart documentation, our own calculation on Yahoo Finance futures data, and the Phidias account rules.
VWAP (volume weighted average price) is the average price of a market since a starting point, with each price weighted by the volume traded at it. Day traders on NQ and ES use it as the session’s fair value: above VWAP, buyers have paid more than the session average; below it, sellers have sold for less. Anchored VWAP starts the same calculation on a bar you choose. It is a reference, not a signal.
Updated on 12 November 2026
In short
- Formula: VWAP = sum of (price x volume) / sum of volume, cumulated from the anchor. We use the typical price (high + low + close) / 3.
- Bands: VWAP plus or minus 1, 2 or 3 volume weighted standard deviations. Median NQ standard deviation at the close in our sample: 72.4 points; ES: 13.1.
- Anchor matters on futures: session VWAP restarts at 6:00 PM ET, RTH VWAP at 9:30 AM ET. On NQ on November 9, 2026 they ended 219 points apart.
- Anchored VWAP: the same line started at a high, a low or an event. It shows where the average trader since that event stands.
- Not a signal: over 47 NQ sessions, the side of VWAP at 10:30 AM matched the close 57% of the time, and 2 sigma touches after 11:30 AM came back to VWAP before the close 44% of the time.
- On a prop account: Express to Live has a static drawdown and no daily loss limit, so a VWAP stop is a fixed dollar amount you can size in micros.
How we checked. On 12 November 2026 we read the VWAP documentation of two futures platforms (CQG and Sierra Chart), TradingView’s anchored VWAP notes, NQ and ES contract terms published by a broker, and our own rules page. We then downloaded NQ and ES futures candles from Yahoo Finance (5 minute, September 3 to November 11, 2026, plus 1 minute for a cross check) and computed VWAP, bands and anchored VWAPs ourselves on 47 complete regular sessions. Yahoo’s series are continuous front month contracts (NQ=F, ES=F), so the sample spans the September 2026 expiry; two days with missing candles were excluded and one bad print (October 30, 3:00 PM ET candle) was removed.
What is VWAP?
VWAP is the volume weighted average price: the average price paid by everyone who traded since the start of the calculation. A price where 10,000 contracts changed hands counts ten times more than a price where 1,000 did. On a chart it is one line that moves slowly, because every new bar is added to the running total.
“VWAP is the volume weighted average price for a futures contract plotted as a line on the price chart.”
CQG, CQG Primer: Volume-Weighted Average Price, September 8, 2025, read on 12 November 2026
CQG adds that the study gives the current VWAP for the trading day or the trading session, so traders can compare price action with it. That is the whole idea: VWAP is a benchmark. If NQ trades 100 points above VWAP, the average buyer of the session is in profit and the average seller is under water. That changes how both sides behave on a pullback, which is why intraday traders keep the line on screen.
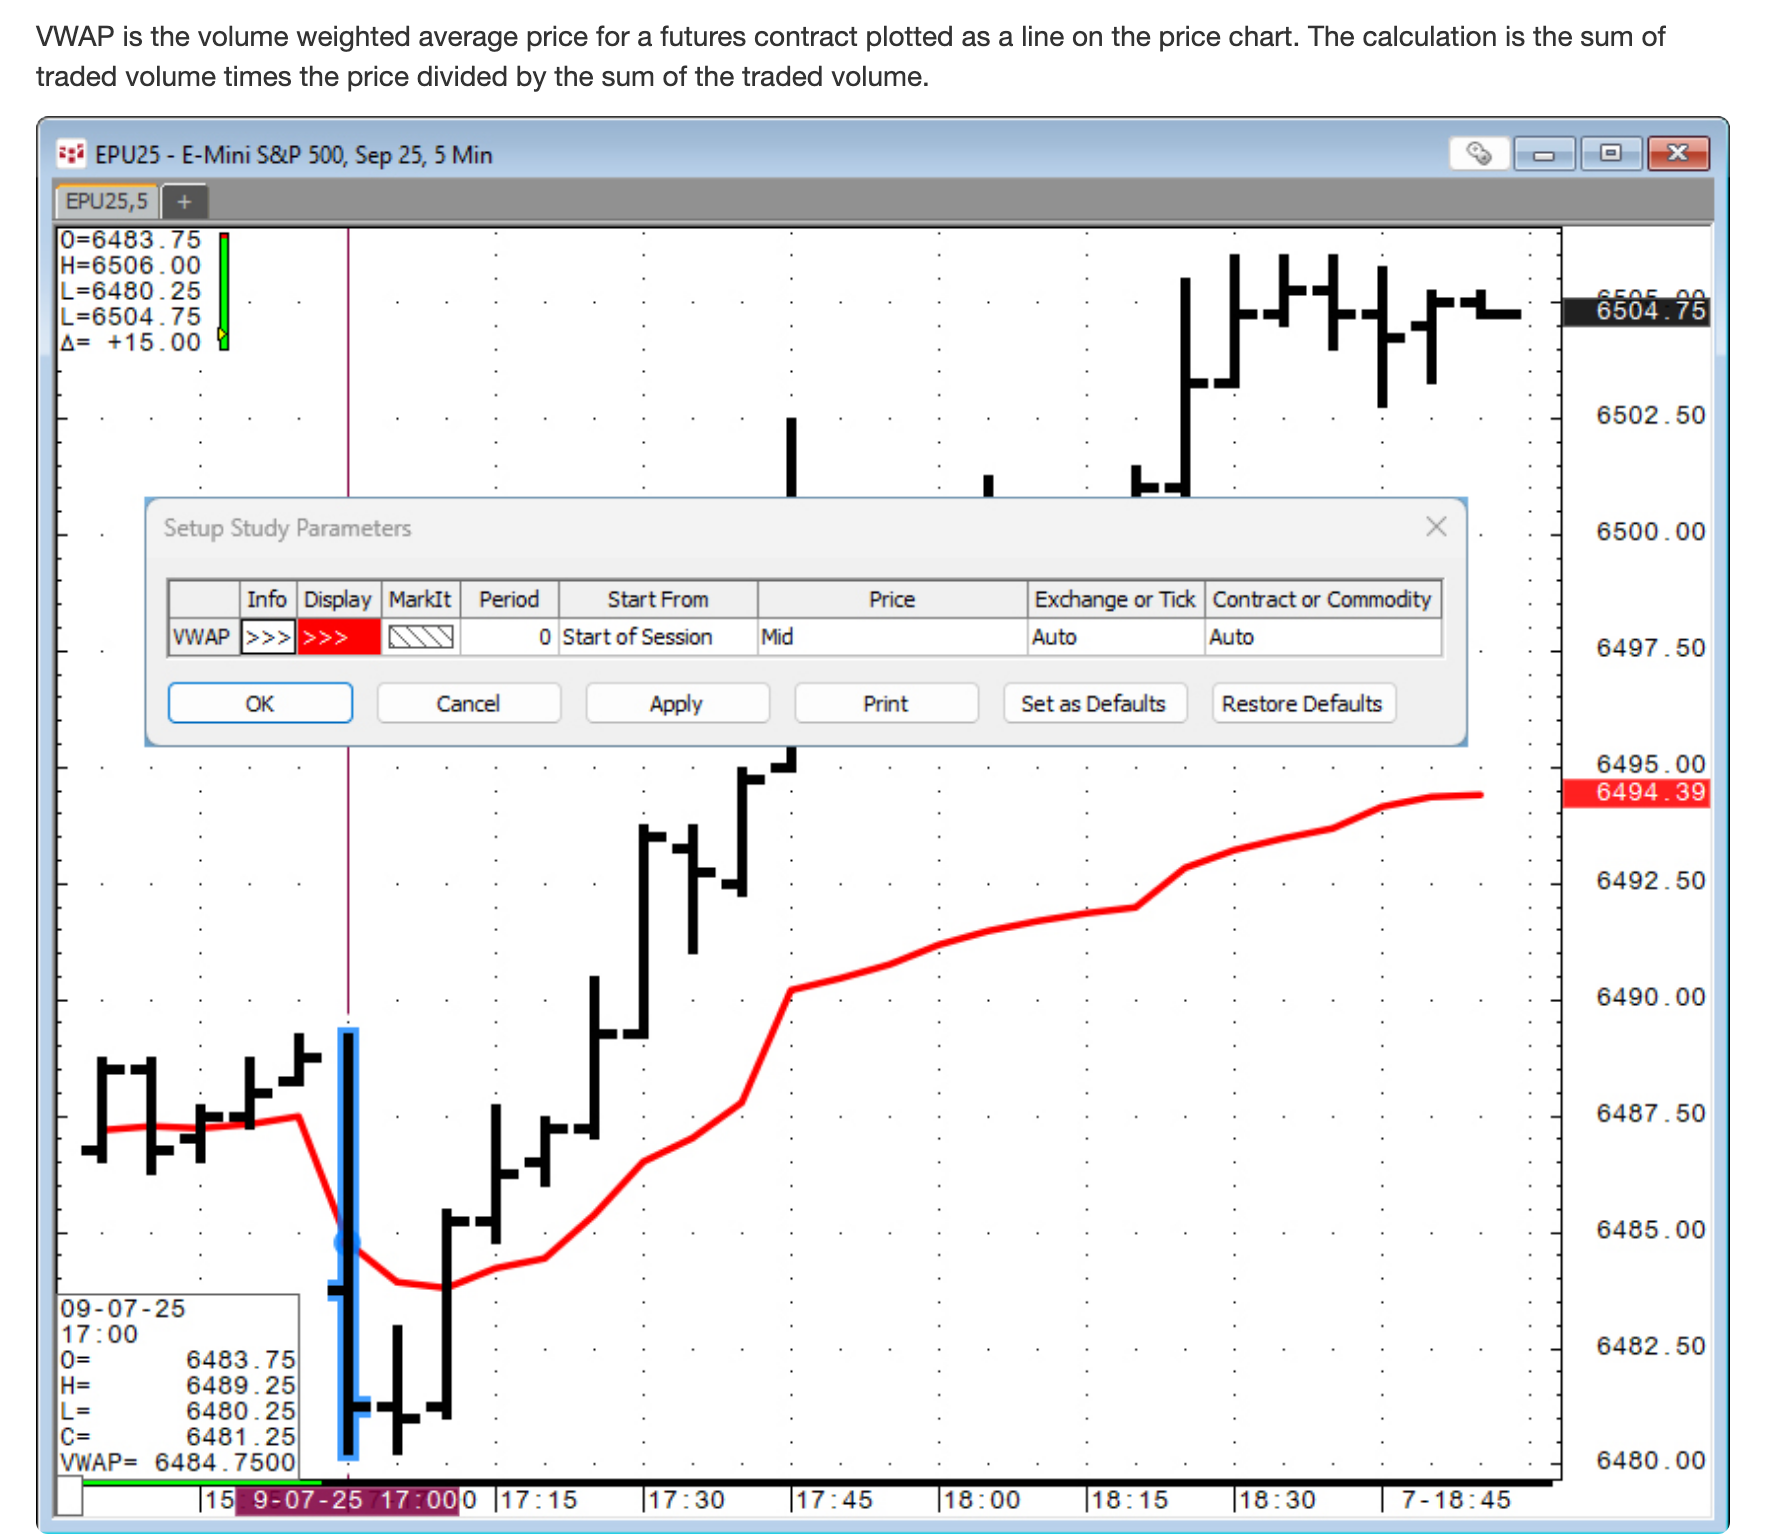
VWAP formula and calculation
VWAP = sum of (price x volume) / sum of volume, cumulated from the anchor. For each bar you multiply a price by the bar’s volume, add the products, and divide by the total volume since the start.
“This calculation gives greater weight to trade prices that have a higher volume.”
Sierra Chart, Technical Studies Reference, VWAP with Standard Deviation Lines, read on 12 November 2026
The catch is which price each bar contributes. We use the typical price, (high + low + close) / 3, a common choice. CQG’s default is the bar midpoint, Sierra Chart’s the last trade of the bar. On NQ on November 9, 2026, the 5 minute regular session VWAP at the close was 27,881.01 with closes, 27,871.02 with midpoints and 27,874.35 with typical prices: 10 points between the extremes.
Bar size matters less than you might think. The same day on 1 minute candles gave 27,873.22, 1.14 points away. Sierra Chart notes that even on one platform, VWAPs on different bar sizes only match exactly when they are built from the underlying data, ideally tick by tick. Know your settings before comparing levels.
VWAP standard deviation bands
VWAP bands are lines drawn at a multiple of the standard deviation above and below VWAP, usually 1, 2 and 3. The standard deviation is volume weighted, so it measures how far from VWAP the volume actually traded.
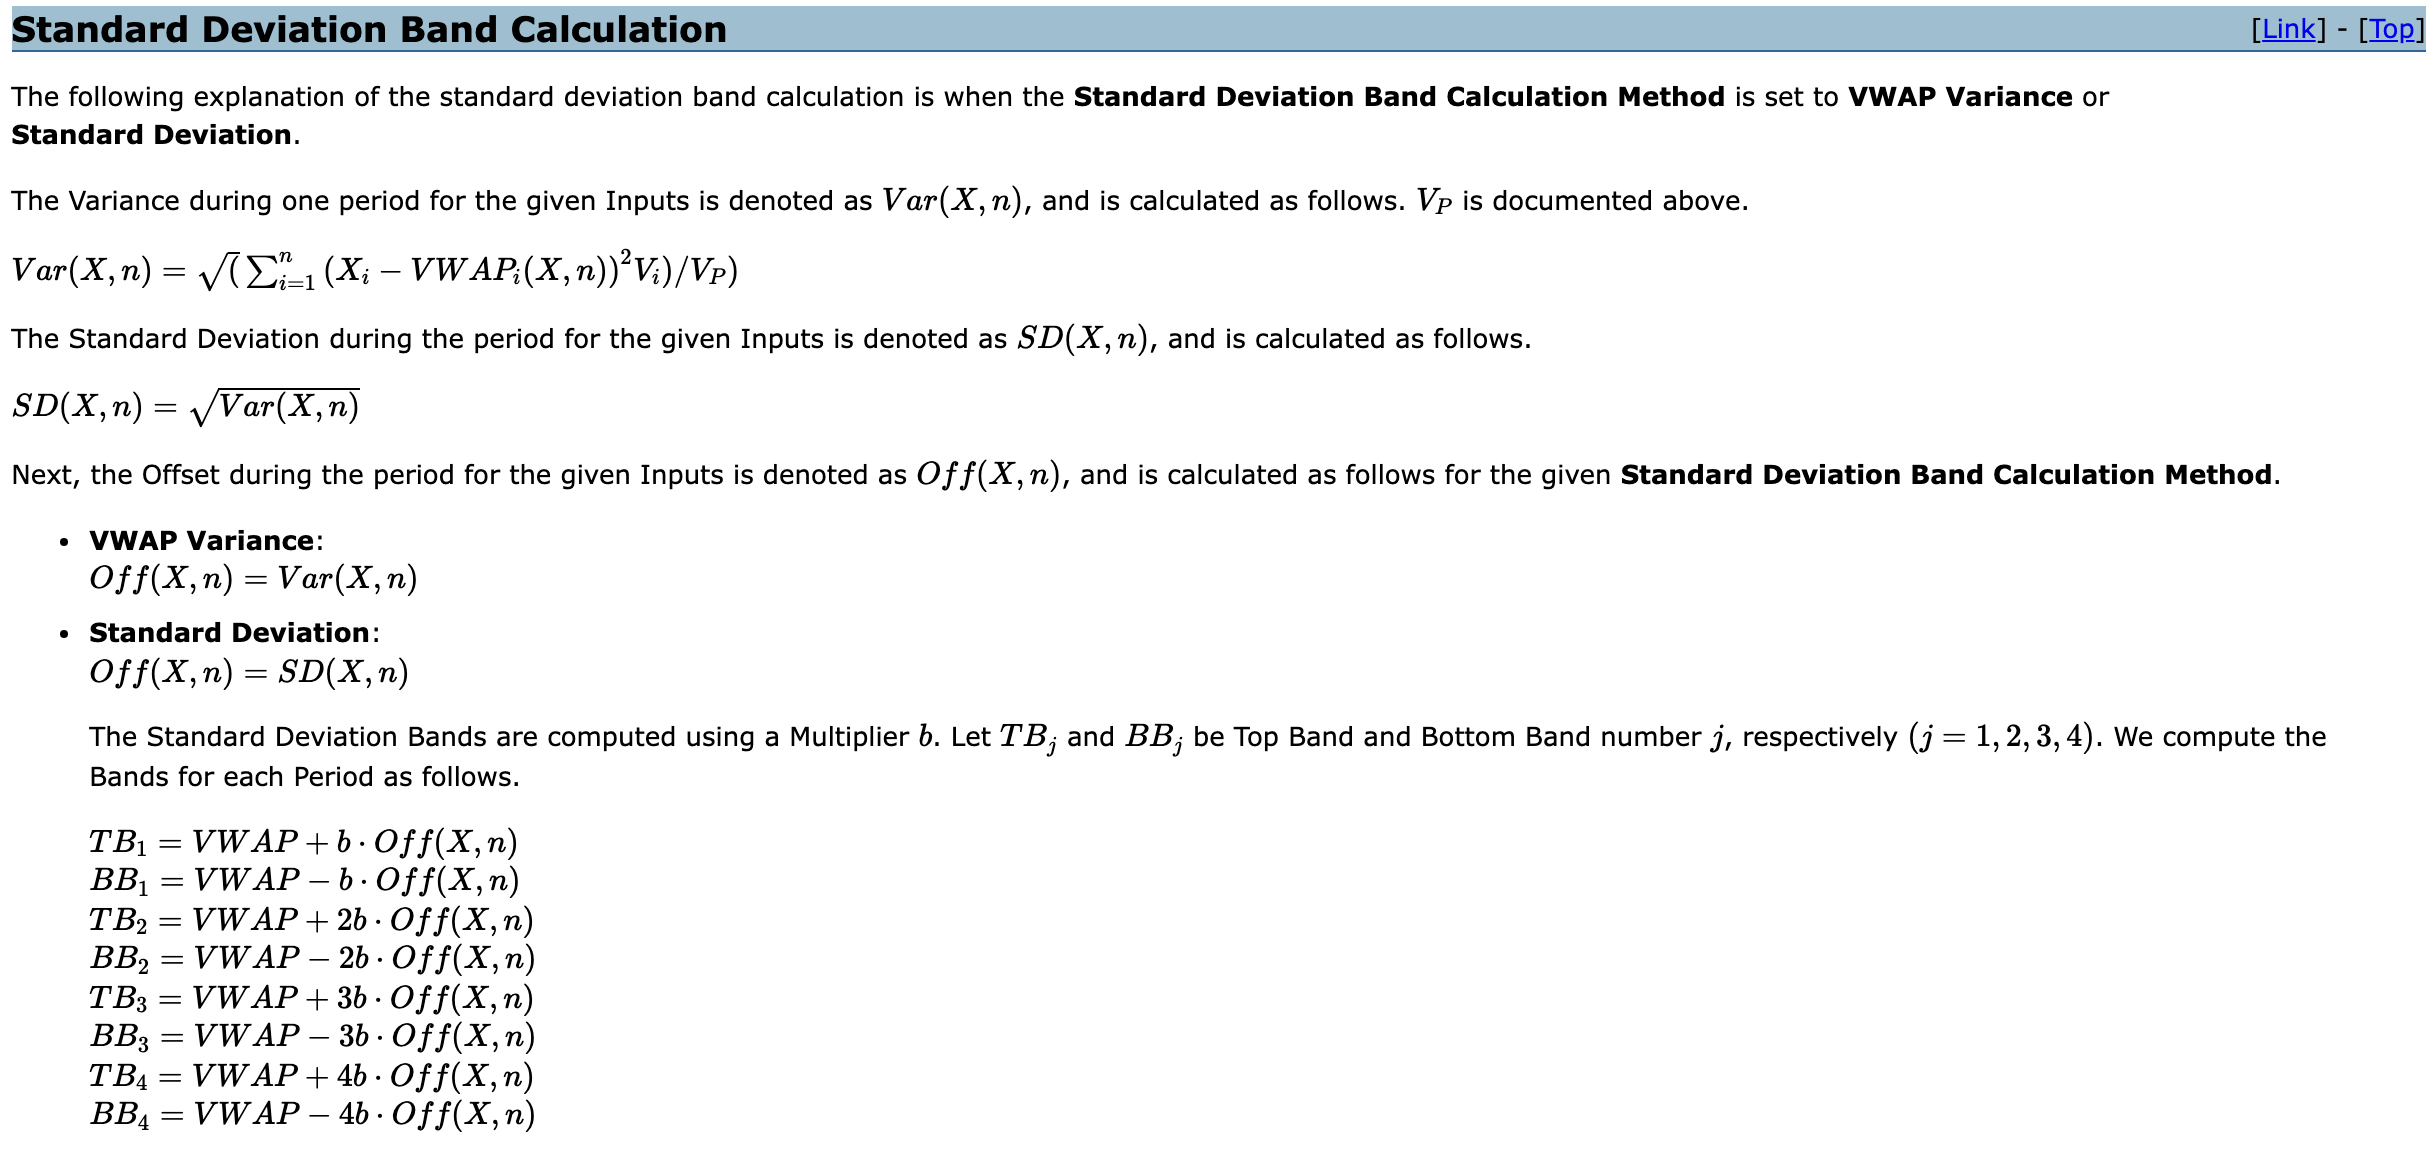
Sierra Chart offers up to 4 bands on each side; a multiplier of 2.0 places the band at 200% of the standard deviation. We used the common formula: sigma = square root of (sum of volume x price squared / sum of volume, minus VWAP squared). Sierra Chart measures each bar against the running VWAP instead, so band values can differ slightly between platforms.
How wide are they on index futures? Over our 47 sessions, the median standard deviation at the 4:00 PM ET close was 72.4 points on NQ and 13.1 points on ES, for median session ranges of 334.2 and 60.2 points. Early in the session the bands are much tighter, because only a few bars feed the calculation. A 2 sigma touch at 9:45 AM is a very different event from one at 2:00 PM.
Which VWAP? Session, RTH and anchored on futures
On futures, “VWAP” means nothing until you say where it starts. CME equity index futures trade Sunday to Friday from 5:00 PM to 4:00 PM Central Time, with a one hour halt, according to the contract terms published by Ironbeam. In New York time, each session opens at 6:00 PM ET, and our data shows no candle between 5:05 and 5:55 PM ET.
The gap is not trivial. On Monday, November 9, 2026, NQ rallied from the overnight lows, so the session VWAP sat 219 points below the RTH VWAP at the close. Across the 47 sessions the median gap was 33.5 points on NQ and 4.0 on ES. If you trade the open, the RTH VWAP describes the crowd you are trading with; if you hold through the overnight session, the session VWAP is the fairer benchmark. CQG’s study lets you begin the calculation at the start of the day or at the start of the session.
Anchored VWAP explained
Anchored VWAP (AVWAP) is the same calculation started on a bar you pick: a swing high, a swing low, a gap, a news candle. It answers one question: where does the average trader who entered since that event stand?
Every standard VWAP is in fact anchored, to the session open. Anchoring it elsewhere is what makes the tool flexible. Sierra Chart’s Draw Anchored VWAP tool starts the line at the bar you click, and TradingView added a VWAP Auto Anchored indicator in January 2022 whose anchor can be the highest high, the lowest low or the highest volume bar of a lookback, with optional standard deviation bands on the drawing tool (TradingView blog).
Anchored VWAP vs VWAP, the first comparison Google suggests: a session VWAP restarts every day, so it only knows today. An AVWAP from a major low keeps accumulating for days, so it tracks the volume weighted average price traded since that low. When price returns to it, buyers since that low are, on average, back near break even. That is a reason for a reaction, not a promise of one, as the next two examples show.
A real example: NQ on November 10, 2026
On Tuesday, November 10, 2026, NQ fell from its 10:00 AM high of 28,090.00 to 27,516.00 at 12:40 PM ET, then closed back above VWAP. The chart below plots 5 minute closes with the regular session VWAP, its 2 sigma bands, and the anchored VWAP from the November 5 low.
Two lines met at the low: the lower 2 sigma band, which NQ overshot by 45 points while ES went 3 points through its own, and the anchored VWAP from the November 5 low, 18 points under the NQ low. Both markets closed above VWAP. It looks like a textbook band fade. The data below says how rarely that is enough on its own.
Anchored VWAP over a week: NQ from November 5 to 11
Two anchored VWAPs framed NQ for a week: one from the October 28 high of 30,178.00, one from the November 5 low of 26,366.50. The chart uses hourly closes; the levels quoted come from 5 minute candles.
- Monday, November 9, 2:45 AM ET: NQ traded down to 26,751.25, 375 points under the anchored VWAP from the low. The “support” simply failed overnight.
- Monday, 3:25 PM ET: the rally stalled at 28,129.25, 54 points under the anchored VWAP from the October 28 high.
- Tuesday, 12:40 PM ET: the pullback low of 27,516.00 held 18 points above the AVWAP from the low.
- Tuesday, 10:05 PM ET: first 5 minute close above the AVWAP from the high. Wednesday’s high reached 28,697.00, 534 points above it.
Read honestly, the week shows both faces of anchored VWAP: a level that framed the market twice and failed once. We picked this week because it is clear, which is exactly why it proves nothing about frequency.
How often does VWAP work? Our count on 47 sessions
Less often than VWAP screenshots suggest. We ran the same calculation on every complete regular session from September 3 to November 11, 2026: 47 sessions on NQ and 47 on ES, 5 minute candles, VWAP anchored at 9:30 AM ET.
VWAP checks on 47 sessions (Sep 3 to Nov 11, 2026)
- Crossings: NQ closed a 5 minute candle on the other side of VWAP a median of 6 times per session (0 to 18). ES: also 6 (0 to 25).
- Trend days: in 10 of 47 NQ sessions (8 on ES), price never crossed VWAP after 10:30 AM. November 9 was one: zero crosses all day.
- Morning side: the side of VWAP at 10:30 AM matched the close in 27 of 47 NQ sessions, 57% (ES: 25 of 47, 53%).
- Band fades: NQ touched a 2 sigma band after 11:30 AM in 32 of 47 sessions and traded back to VWAP before the close in 14, 44% (ES: 18 of 37, 49%).
This is a description of raw behavior, not a backtest: no entry rule, no stop, no costs. What it does show is that VWAP is a reference, not a signal. The edge, if any, comes from what you combine it with.
How day traders use VWAP on NQ and ES
Day traders use VWAP in three ways: as a filter for the side of the market, as a target for mean reversion, and as anchored levels from major swings. Each has a limit our data makes visible.
- Trend filter and pullbacks. Above VWAP, look for longs on pullbacks that hold it; below, shorts. On November 9, NQ never closed a 5 minute candle below VWAP, and after 10:30 AM its deepest pullback stayed 56 points above it. The limit: the 10:30 AM side held to the close only 57% of the time.
- Mean reversion from the bands. Price stretched to 2 sigma is far from where volume traded, so some traders fade it toward VWAP. The limit: back to VWAP in 44% of NQ touches. Wait for a rejection, a liquidity sweep or an order flow shift before treating the band as a level.
- Anchored VWAP levels. Anchor at the high and low of the last big move and watch the reaction when price returns. The limit: the November 5 AVWAP broke by 375 points before it held.
Decide your anchor before the session and check the futures trading hours so you know when your line restarts.
VWAP vs EMA, and is VWAP lagging?
VWAP and an EMA are both averages, but they weight different things. An exponential moving average weights the most recent prices more and rolls forward over a fixed number of bars. VWAP weights each price by its volume and accumulates from its anchor until it restarts.
Yes, VWAP lags: it is built from past prices. It also slows down through the day, because each new candle is a smaller share of the session’s total volume. By 2:00 PM ET, a 5 minute candle adds one bar to more than 50 already counted. That is why VWAP is useful as a benchmark late in the session and a poor timing tool on its own. CQG also offers a version without an anchor, computed over a set lookback, which it describes as smoothing price similar to a standard moving average. For a wider view of how VWAP fits with other tools, see our best indicators for day trading.
Sizing a VWAP stop: NQ vs MNQ
A VWAP setup has a stop at a known price, so the contract you choose decides whether that stop fits your account. Take the November 10 example: a long near the lower band at 27,560 with a stop under the anchored VWAP at 27,480 is an 80 point risk.
That is the practical case for micros on VWAP trades. Point values come from the CME contract terms as published by Ironbeam: NQ is $20 x the Nasdaq-100 index, MNQ is $2, and both move in 0.25 point ticks. The same logic on ES: $50 a point, $5 on MES. Measure the distance from entry to the line that invalidates your idea, whether it is VWAP, a band or an anchored VWAP, then pick the contract that makes that distance a small share of your drawdown.
Trading VWAP setups on a prop firm account
On Phidias Express to Live, the rules are built so that a VWAP stop is a fixed amount you can plan around.
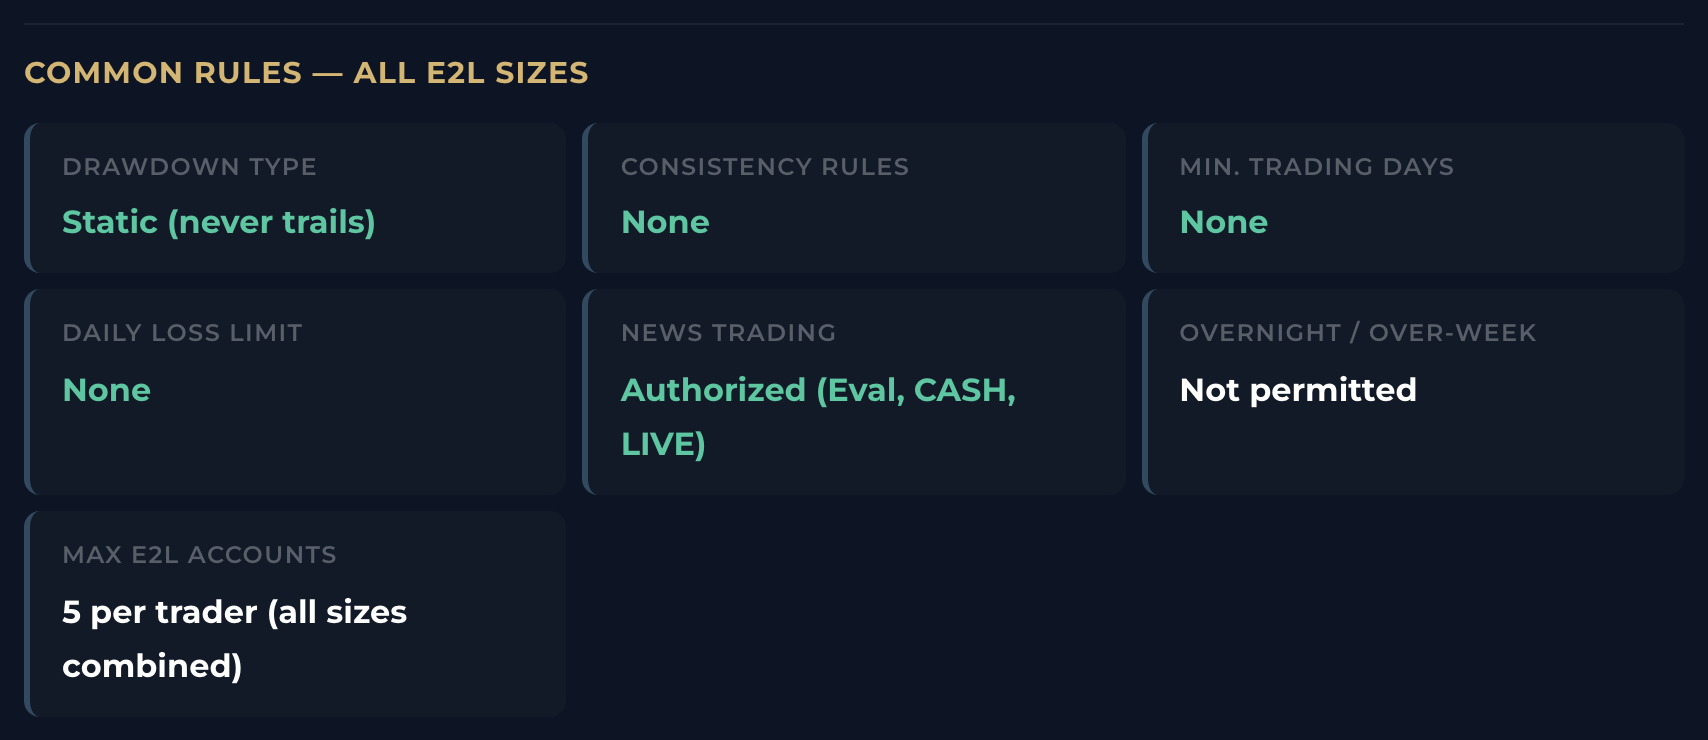
“The static drawdown never trails.”
Phidias Propfirm, Rules, Express to Live liquidation formula, read on 12 November 2026
- Static drawdown: $500 on 25K, $650 on 50K, $800 on 100K, $1,000 on 150K. A winning VWAP trade never drags your floor up. Our static drawdown guide explains why that matters.
- No daily loss limit and no consistency rule, so one stopped band fade does not end your day by rule (see prop firms with no daily loss limit).
- Intraday only: positions are closed before the end of the trading day, which fits a VWAP that restarts every session.
- NQ, ES, MNQ and MES are all authorized, from 2 E-mini or 20 micro on 25K to 9 E-mini or 90 micro on 150K.
Your first payout converts the account to LIVE, and the full cycle can run in a single day: our record from purchase to payout is 6 hours 18 minutes, and 90% of payouts are processed in under 30 minutes. Bought as a one-time payment, the 25K Express to Live goes from $277 to $69 with code PHIDIAS.
Get an Express to Live account
Test: how should you use VWAP?
Three questions. No email.
30 second check
How should you use VWAP?
VWAP 2026: frequently asked questions
What does VWAP stand for?
VWAP stands for volume weighted average price: the average price of a market since a starting point, where each price counts in proportion to the volume traded at it. On futures charts it is drawn as a line, usually restarted at each trading session, and traders compare the current price with it.
What does VWAP mean in trading?
In trading, VWAP is used as a fair value reference for the session: price above VWAP means buyers have paid more than the volume weighted average so far, price below means the opposite. It describes where volume has traded; it does not predict where price goes next.
How is VWAP calculated?
VWAP = sum of (price x volume) / sum of volume, cumulated from the anchor. We use the typical price (high + low + close) / 3 of each bar, but platforms differ: CQG defaults to the bar midpoint, Sierra Chart to the last trade of the bar. On NQ on November 9, 2026, those choices moved VWAP by 10 points.
What are the upper and lower VWAP bands?
They are VWAP plus and minus a multiple of the volume weighted standard deviation of price since the anchor, usually 1, 2 or 3. Over 47 NQ sessions from September 3 to November 11, 2026, the median standard deviation at the close was 72.4 points, so the 2 sigma band sat about 145 points from VWAP.
What is anchored VWAP?
Anchored VWAP is the same calculation started on a bar you choose, such as a swing high, a swing low or a news candle, instead of the session open. It shows the average price paid by everyone who traded since that event. Standard VWAP is an anchored VWAP whose anchor is the session start.
When does VWAP reset on NQ and ES futures?
It depends on your settings. A session VWAP restarts at 6:00 PM ET, when CME equity index futures reopen after the 5:00 to 6:00 PM ET halt, according to contract terms published by Ironbeam. An RTH VWAP restarts at the 9:30 AM ET open. On November 9, 2026, the two NQ values ended 219 points apart.
Is VWAP a lagging indicator?
Yes. VWAP is an average of past prices and volume, so it lags price. It also gets slower as the session goes on, because every new bar is a smaller share of the cumulative volume. The bands follow a different logic: they start narrow because only a few prices are in the calculation, and widen as the session’s range grows.
Is VWAP better than an EMA?
They answer different questions. An EMA weights recent prices more and never resets; VWAP weights prices by volume and restarts at its anchor. VWAP is better as a session or event reference, an EMA as a trend filter over a fixed number of bars. Neither is a signal on its own.
Can you trade VWAP setups on a prop firm account?
Yes, VWAP setups are intraday. On Phidias Express to Live the drawdown is static and never trails, there is no daily loss limit and no consistency rule, positions are closed before the end of the trading day, and NQ, ES, MNQ and MES are authorized. Your first payout converts the account to LIVE.
Related guides
Read it yourself
- CQG: Primer, Volume-Weighted Average Price (definition, start of session, price input)
- Sierra Chart: VWAP with Standard Deviation Lines (formula, bands, Draw Anchored VWAP)
- TradingView: VWAP improvements across the board (VWAP Auto Anchored, bands on Anchored VWAP)
- Ironbeam: E-mini Nasdaq-100 futures (NQ) contract specifications
- Ironbeam: Micro E-mini Nasdaq-100 futures (MNQ) contract specifications
- Ironbeam: E-mini S&P 500 futures (ES) contract specifications
- Yahoo Finance: NQ=F 5 minute candles (data used for our calculation)
- Phidias rules (Express to Live)
The verdict
“VWAP is the most useful single line I know for seeing who is winning the session, and anchored VWAP is the best way to see where last week’s buyers and sellers stand. Neither tells you when to click: in our data the bands and the morning side were close to a coin flip. Use VWAP to decide where your stop goes, size it in micros, and trade it on an account where the floor does not move when you win.”
William G., CMO at Phidias Propfirm
William G., CMO at Phidias Propfirm, works on futures prop trading rules and payouts every day. Last reviewed 2026.
Definitions as published by CQG, Sierra Chart and TradingView, and rules as published by Phidias in November 2026. The NQ and ES figures use Yahoo Finance data from September 3 to November 11, 2026; they are an illustration, not a backtest. Trading futures involves substantial risk of loss. This article is educational and is not trading advice.