Risk reward ratio 2026
The risk reward ratio, the win rate it demands, and how many NQ, MNQ, ES or MES contracts a prop firm drawdown really allows.
Every number below is computed, with the formula next to it.
The risk reward ratio compares what a trade risks (entry to stop) with what it aims to make (entry to target). At 1:2 you risk $1 to make $2, so you break even with a 33.3% win rate. At 1:1 you need 50%, at 1:3 only 25%. The formula: breakeven win rate = 1 / (1 + R).
Updated on 12 November 2026
How we checked
- Contract specs: the four CME Group contract spec pages for MNQ, NQ, MES and ES, read on 12 November 2026.
- Prop firm rules: our own rules page (Express to Live grid for 4 sizes, common rules, commission tables), read the same day.
- Math: every win rate, dollar amount and contract count is computed from those pages; the formulas are written next to the results.
In short
- Breakeven win rate = 1 / (1 + R). 1:1 needs 50%, 1:2 needs 33.3%, 1:3 needs 25%, 1:4 needs 20%.
- Commissions raise the bar: one MNQ at 1:2 on a 20 point stop needs 34.58% after a $1.50 round trip, and 38.33% on a 5 point stop.
- Ticks to dollars: MNQ $0.50 a tick, NQ $5, MES $1.25, ES $12.50. Four ticks make one point.
- Position size = risk / (stop in points x point value). $100 of risk on a 20 point Nasdaq stop is 2 MNQ, and zero NQ.
- Risk per trade decides survival: at $100 on a $500 drawdown, the 5th straight loser ends the account; at $50, the 10th.
- A static drawdown makes sizing predictable: the floor never moves, so profit becomes room you can size on.
What is the risk reward ratio?
It is the size of your potential loss next to the size of your potential gain on one trade. Measure both from your entry: the distance to the stop is the risk, the distance to the target is the reward. Write it as risk to reward, so 1:2 means you risk one unit to make two.
On futures, measure it in points or ticks, then convert to dollars with the contract’s point value. A long MNQ with a stop 20 points below entry and a target 40 points above is a 1:2 trade. MNQ is worth $2 per point, so one contract risks $40 (80 ticks) to make $80 (160 ticks).
The ratio says nothing on its own about whether the trade is good. It tells you how often you must be right: with a 1:2 trade, one winner pays for two losers, so you can be wrong two times out of three and finish flat before costs.
Risk reward ratio and win rate: the breakeven table
Breakeven win rate = risk / (risk + reward), or 1 / (1 + R). At that win rate the winners exactly pay for the losers. Above it, the strategy makes money before costs; below it, it loses, however good the setups feel.
Breakeven win rate by risk reward ratio
This is why a quoted win rate means little without the ratio behind it. A strategy that wins 60% of the time at 1:0.5 loses money, because it needs 66.7%. One that wins 35% at 1:2 makes money before costs, because it needs 33.3%. The same applies to the setups traders ask us about most, from smart money concepts to order blocks: judge the win rate against the ratio it was measured at.
Expectancy: what one trade is worth on average
Expectancy = win rate x R, minus loss rate x 1, in units of risk. It turns the ratio and the win rate into a single number: what an average trade adds or costs.
- 40% at 1:2: 0.4 x 2 = 0.8, minus 0.6 = +0.2R. With $100 of risk, that is +$20 per trade on average.
- 30% at 1:2: 0.6 minus 0.7 = minus 0.1R. Below the 33.3% breakeven, every trade costs $10 on average.
- 50% at 1:1: 0.5 minus 0.5 = zero. Commissions make it negative.
- 60% at 1:1: 0.6 minus 0.4 = +0.2R, the same edge as 40% at 1:2.
The last line matters: a high win rate and a high ratio are two routes to the same edge. Pick the one that matches how you actually trade, then check it against your own journal, not against a target someone else hits.
What is a good risk reward ratio for futures?
A good ratio is one your real win rate clears with a margin, after commissions. There is no universal number. A scalper working near 1:1 needs more than 50% winners; a trend trader at 1:3 can live with 30% to 35%.
What most traders forget is cost. Commissions are charged per side and per contract, so they weigh more on small stops. Here is what our rules page commissions do to the breakeven of a 1:2 trade:
Same 1:2 ratio, four different breakevens. On a 5 point MNQ stop, costs add 5 points of win rate to the 33.3% you started from. If you scalp small stops, measure your ratio net of commissions.
On the Rithmic data feed the rates differ: $1.58 per MNQ round trip (34.65% on the 20/40 trade, 38.6% on the 5/10) and $4.40 per NQ round trip (33.7%). Our rules page marks all these amounts as indicative: they can change with broker and exchange pricing.
Risk reward in ticks and points on NQ, MNQ, ES and MES
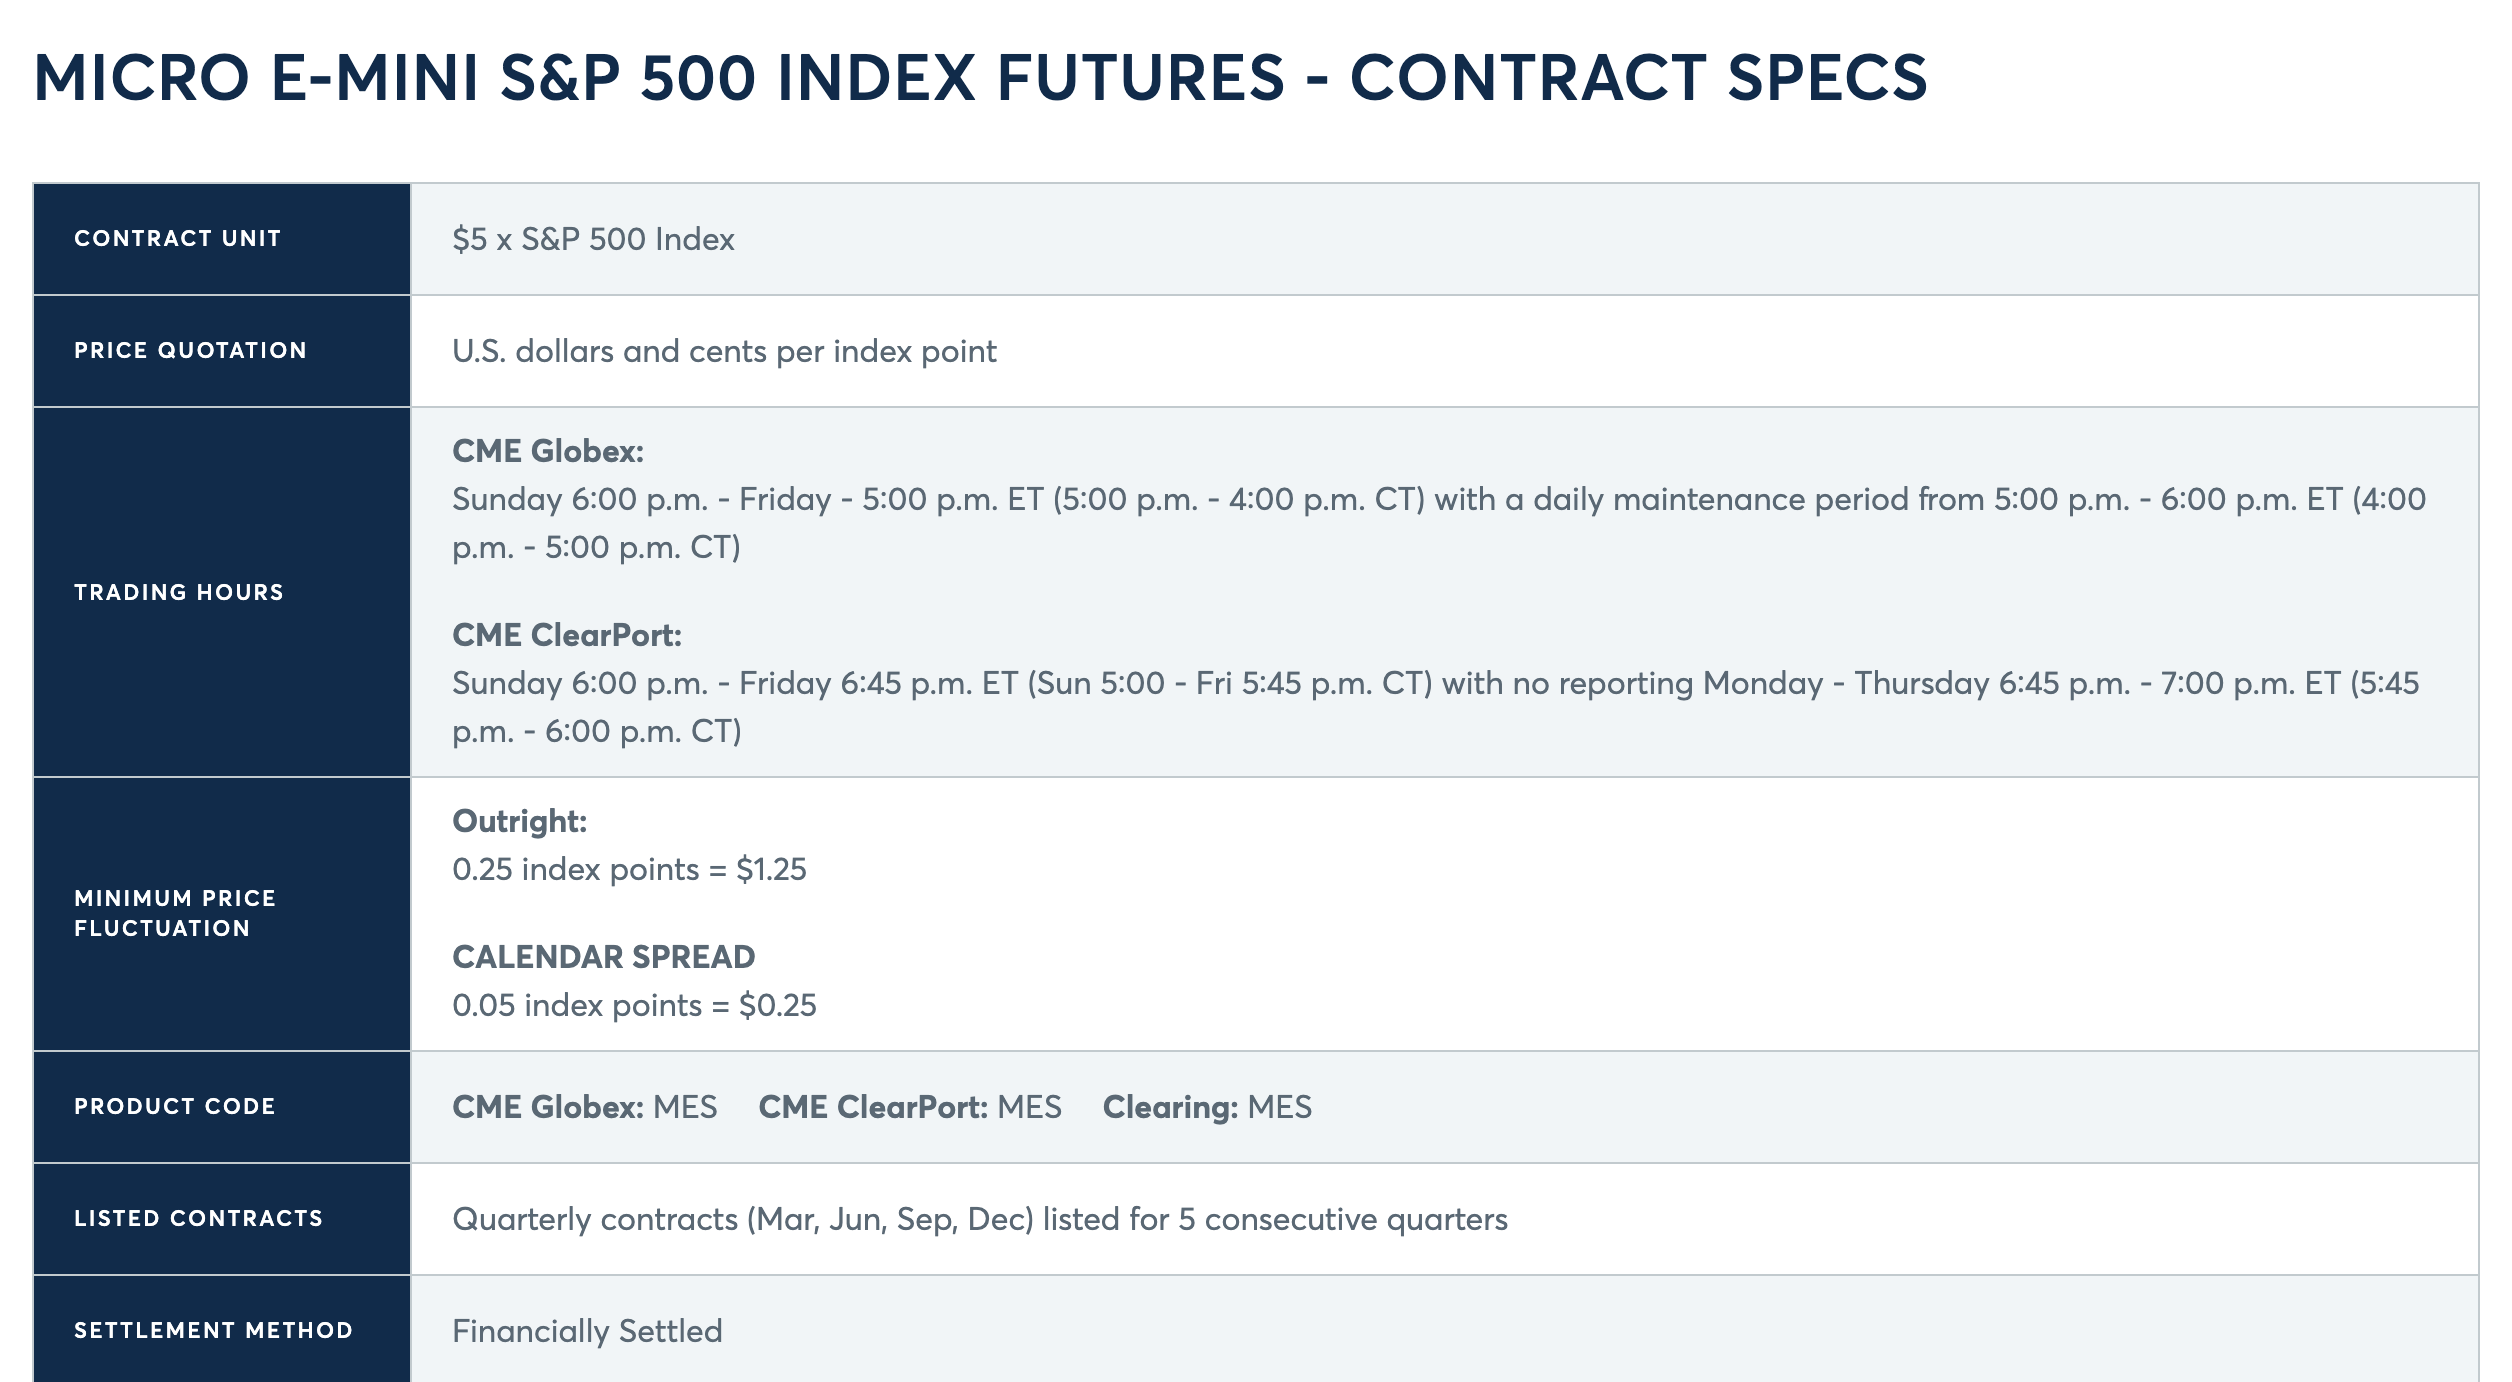
All four contracts move in 0.25 point ticks, so four ticks make one point. Only the dollar value changes. These are CME Group’s contract specs, read on its product pages:
The Micro E-mini Nasdaq-100 futures contract is $2 x the Nasdaq-100 Index and has a minimum tick of 0.25 index points
CME Group, Micro E-mini Nasdaq-100 contract specs, read on 12 November 2026 (cmegroup.com)
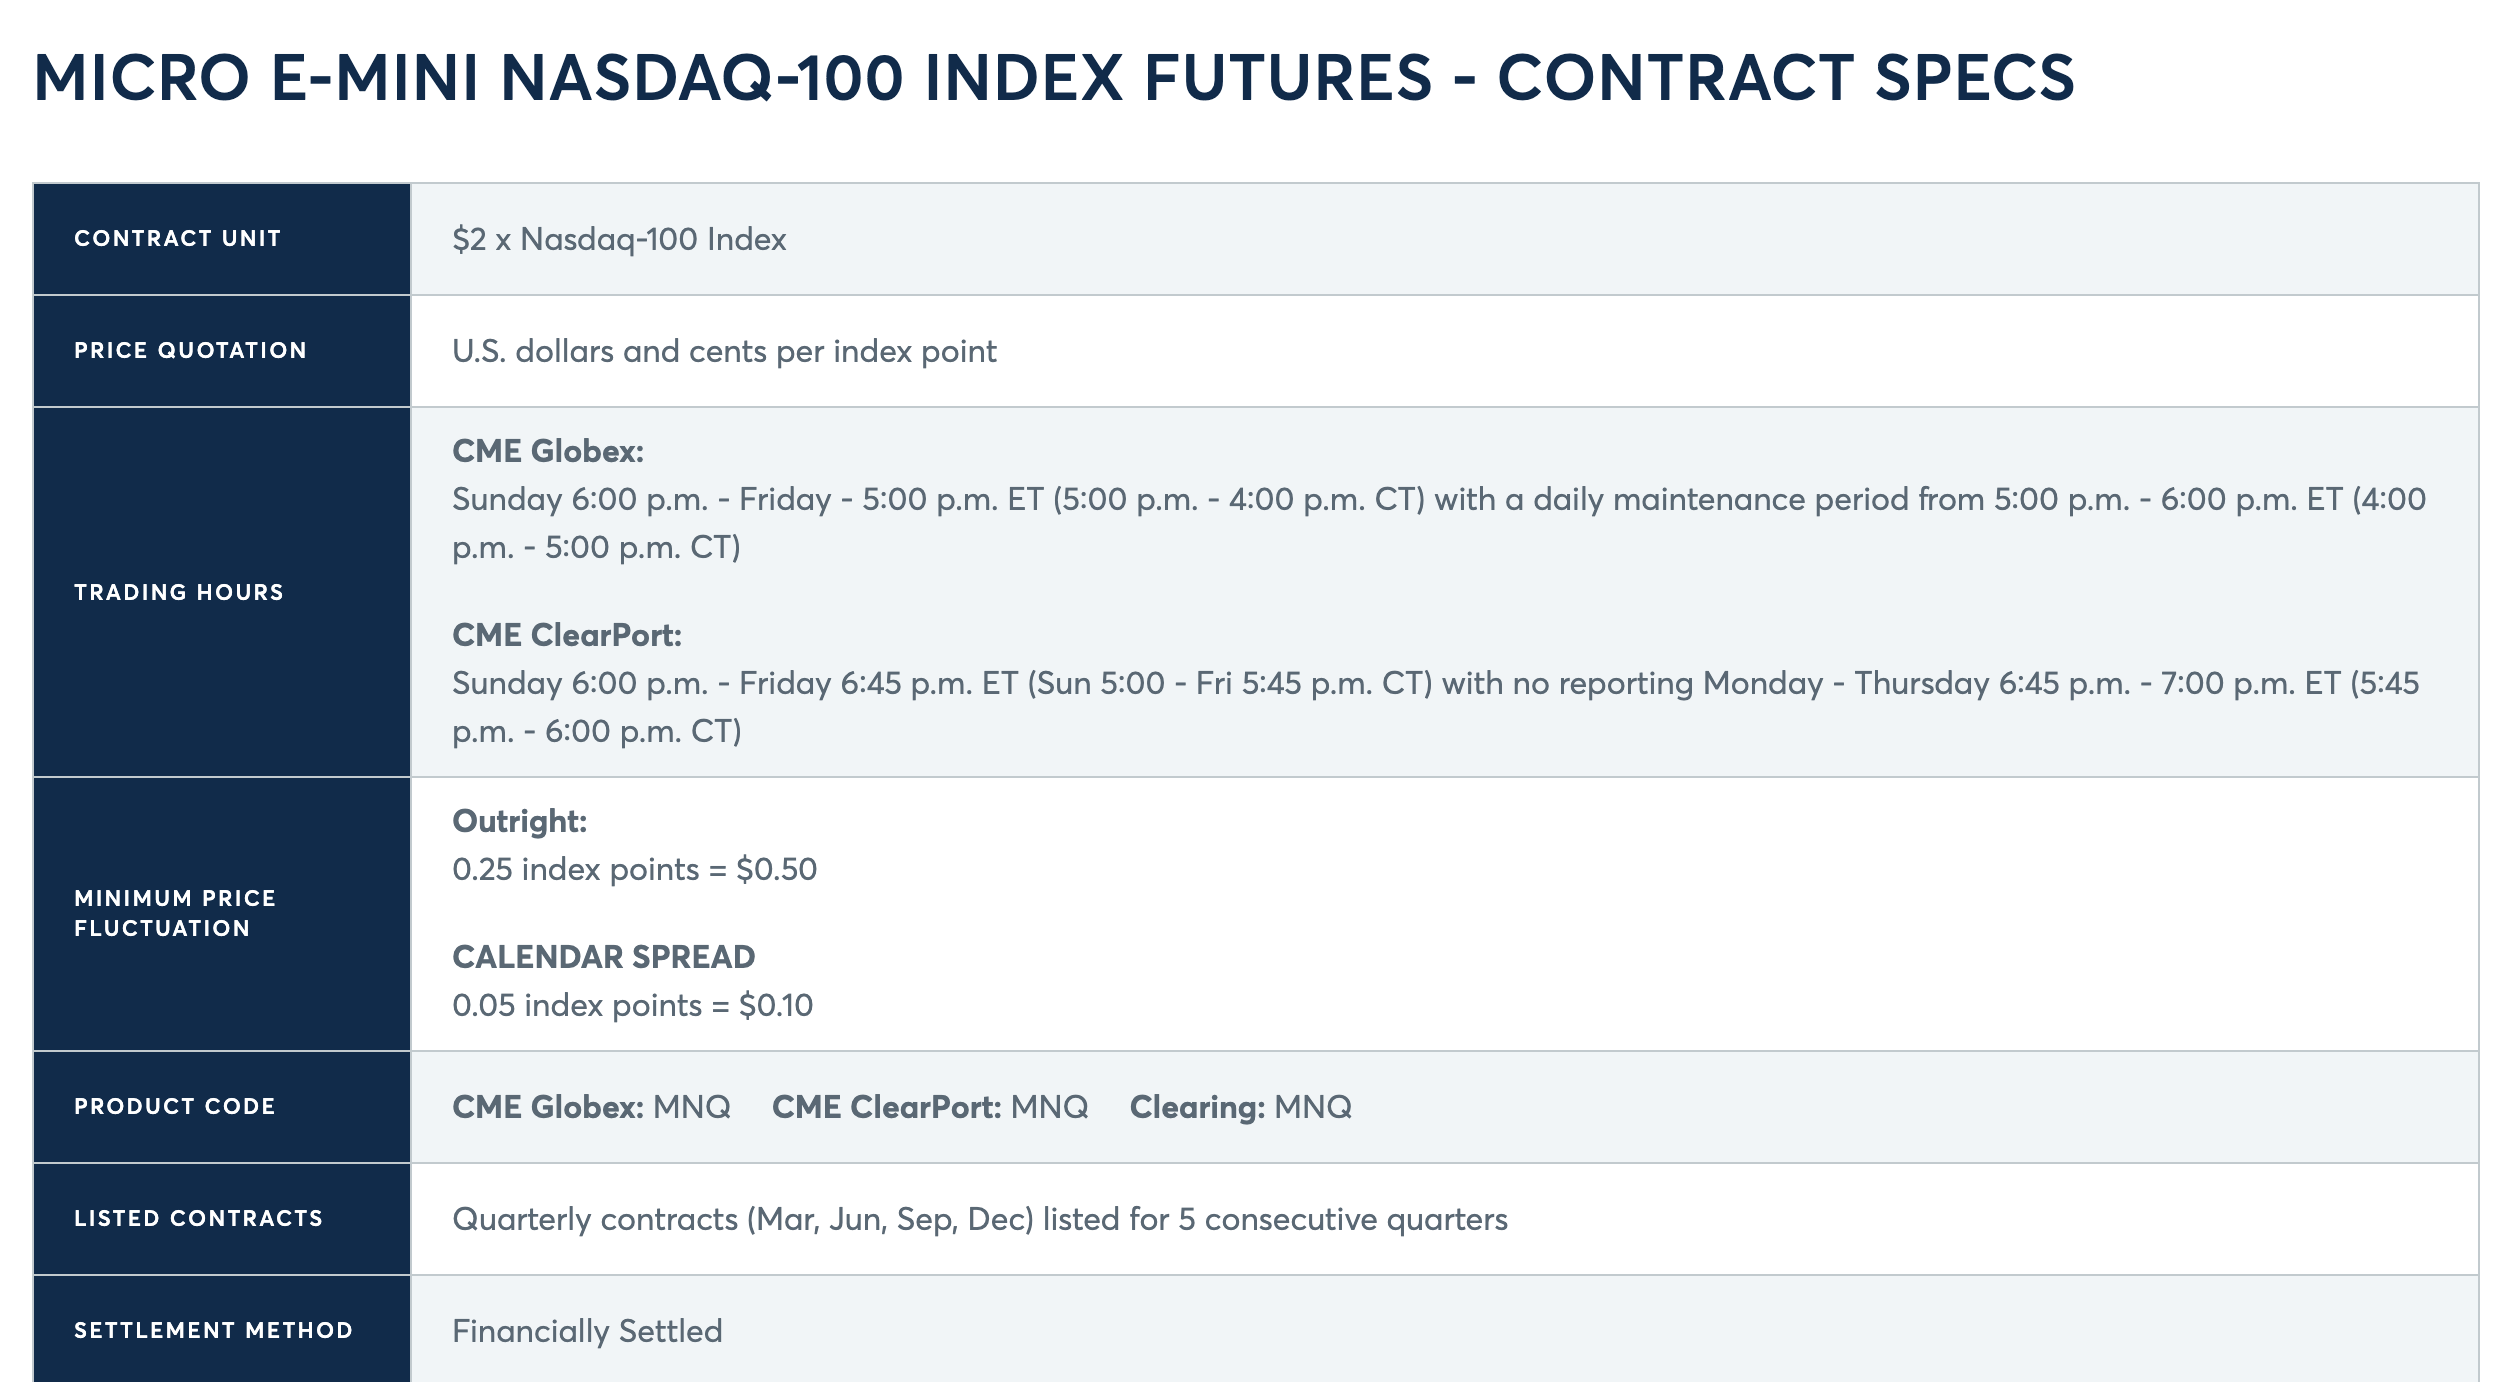
Ten micros equal one E-mini in dollars per point: 10 x $2 = $20 on the Nasdaq, 10 x $5 = $50 on the S&P 500. A ratio is the same in points and in dollars, so a 1:2 trade stays 1:2 whatever the contract; only the dollars at risk change.
Position sizing: how many contracts for your stop
Contracts = risk per trade in dollars / (stop in points x point value), rounded down. Decide the risk first, let the setup give you the stop, and the size follows. Never the other way round.
- Step 1, the risk: a share of the room above your floor. 10% is a prudent start, 20% a ceiling: on a 25K Express to Live, 20% of $500 = $100.
- Step 2, the stop: where the trade idea is wrong, say 20 Nasdaq points (80 ticks).
- Step 3, the cost per contract: 20 x $2 = $40 on MNQ, 20 x $20 = $400 on NQ.
- Step 4, the size: $100 / $40 = 2.5, so 2 MNQ ($80 at risk). On NQ, $100 / $400 = 0.25: no trade.
The matrix uses the 20% ceiling of each Express to Live drawdown: $100 on 25K, $130 on 50K, $160 on 100K, $200 on 150K. At 10%, halve the risk and round down again. Every result stays under our evaluation and CASH limits of 20, 50, 70 and 90 micros. A tight 5 point NQ stop ($100 per contract) fits one NQ on the 25K, two on the 150K.
Risk per trade under a prop firm drawdown
Your risk per trade decides how many losers in a row the account survives. On a 25K Express to Live, the static drawdown is $500 and the account is liquidated when the balance reaches $24,500. At $100 per trade, you survive 4 straight losses and the 5th ends it; at $50, you survive 9. Commissions bring that moment closer.
Streaks are not rare. At a 40% win rate, the chance that a given run of 5 trades are all losers is 0.6 to the power of 5, or 7.8%. Over 100 trades, at least one run of 5 losses shows up 97.6% of the time, and a run of 10 losses 20.5% of the time (51.6% over 300 trades). So a fixed $100 is a ceiling, not a plan: recompute the risk from the room left after every loss. At 20% of the room, the budget goes $100, then $80, then $64, and the size shrinks before the floor does.
The room is also measured against the target. On the 25K, the profit target is $1,500, three times the $500 drawdown. At $100 of risk and 1:2, each winner adds $200 before costs, so 8 winners cover the target if nothing is lost along the way. The ratio gets you to the target; the risk per trade keeps you in the game while you get there.
Why a static drawdown makes sizing predictable
With a static drawdown, the liquidation level is a fixed number, so your room is simply balance minus floor. That makes every sizing decision a calculation you can do before the trade.
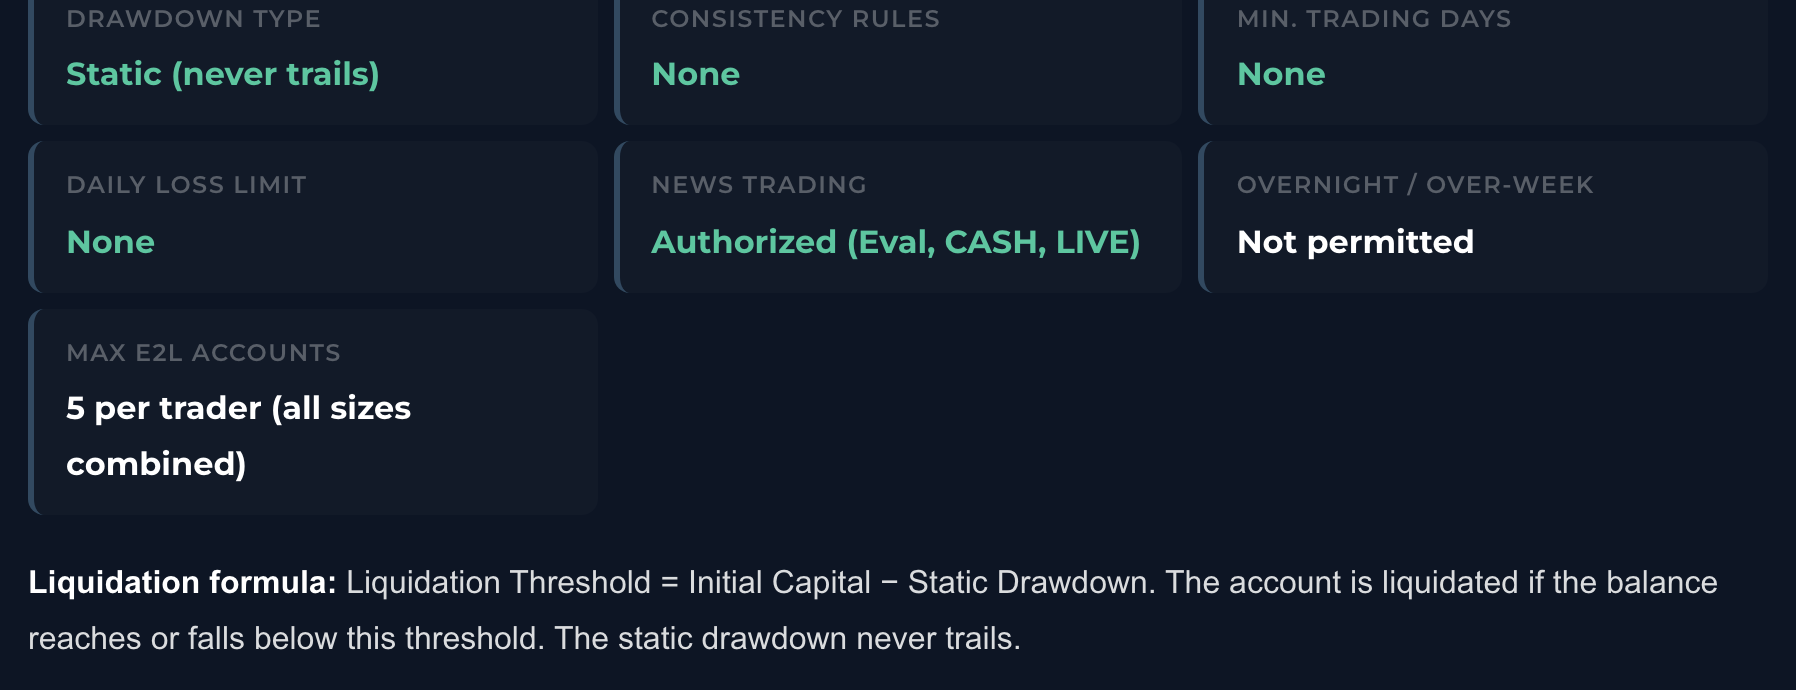
The account is liquidated if the balance reaches or falls below this threshold. The static drawdown never trails.
Phidias rules, Express to Live common rules, read on 12 November 2026 (phidiaspropfirm.com/rules)
Take the same +$300 day on a 25K. On our Express to Live, the floor stays at $24,500: room grows from $500 to $800, and 20% of it ($160) is 4 MNQ on a 20 point stop. On a floor that trails the peak by $500, it moves up to $24,800: room stays $500, and you are still at 2 MNQ.
Read our static drawdown prop firms guide for how fixed floors compare across the market, and why we run no daily loss limit on Express to Live.
The honest trade off. Our Express to Live drawdown is small in dollars: $500 on 25K up to $1,000 on 150K. That is exactly why the ratio and the size matter on it. In return, the floor never trails, there is no daily loss limit, no consistency rule and no minimum days, and payout on Day 1 is possible on every size.
Common risk reward mistakes on a funded account
- Moving the stop, not the size. Widening a stop to fit a contract you cannot afford changes the ratio and the risk at once. Cut the size instead.
- Quoting gross ratios. On a 5 point MNQ stop, a $1.50 round trip turns a 1:2 trade into roughly 1:1.6 net ($11.50 against $18.50).
- Ignoring the streak. Risking $250 on a $500 drawdown means 2 losers end the account, whatever the ratio.
- Sizing on the profit target. The target tells you where you want to go; the drawdown tells you how much you can lose on the way.
- Chasing a 1:5 setup with a 15% win rate. Its breakeven is 16.7%; a few bad weeks erase it. Check the win rate before the ratio.
The fix is the same in each case: write down the risk in dollars before the trade, check it against the room left above your floor, and log the result net of costs. Our guide on how to pass a prop firm challenge turns that into a routine.
Risk reward and sizing at Phidias Express to Live
Express to Live gives every size a static drawdown and limits written in both units. Here is the grid, read on our rules page on 12 November 2026:
News trading is authorized in evaluation, CASH and LIVE; positions cannot be held overnight. 90% of payouts are processed in under 30 minutes, all within 24 hours, and our record from evaluation purchase to payout is 6 hours 18 minutes. Your first payout converts the account to LIVE; LIVE accounts have their own contract limits, listed on the rules page.
Size your first trade on Express to Live
Test: is your risk reward ratio sized for your account?
Four questions on your ratio, your risk per trade and your contract. No email. The result points to the one fix that matters most for your account: the size, the ratio, or the type of drawdown you trade on. Every rule it mentions is written out in the sections above, with the numbers.
30 second check
Is your risk reward ratio sized for your account?
Risk reward ratio: frequently asked questions
What is a good risk reward ratio?
There is no single good ratio: it has to match your win rate. At 1:2 you break even with a 33.3% win rate, at 1:1 you need 50%, at 1:3 only 25%. A ratio is good when your real win rate sits clearly above its breakeven, after commissions.
How do you calculate the risk reward ratio?
Divide the distance from entry to target by the distance from entry to stop. A 20 point stop and a 40 point target on MNQ is 1:2: $40 at risk to make $80 on one contract, since MNQ is worth $2 per point.
What win rate do you need with a 1:2 risk reward ratio?
33.3% before costs, from the formula 1 / (1 + 2). Commissions push it up: on one MNQ with a 20 point stop and a 40 point target, a $1.50 round trip moves the breakeven to 34.58%. On a 5 point stop and a 10 point target it becomes 38.33%.
Is a 1:3 risk reward ratio better than 1:2?
Only if your win rate holds. A 1:3 trade needs 25% winners to break even, a 1:2 trade 33.3%. Wider targets are hit less often, so compare expectancy: win rate times reward, minus loss rate. 40% at 1:2 gives +0.2R per trade.
How many contracts should I trade on a prop firm account?
Contracts = risk per trade / (stop in points x point value), rounded down. Risking $100 on a 25K Express to Live with a 20 point Nasdaq stop gives 2 MNQ ($40 each). One NQ on the same stop risks $400, four times the plan.
How much should you risk per trade on a $500 drawdown?
Decide how many losers in a row you must survive. At $100 per trade (20% of $500) the 5th straight loss reaches the $24,500 floor and ends the account; at $50 (10%) it is the 10th. At a 40% win rate, a run of 5 losses appears in 97.6% of 100 trade samples, so treat 20% as a ceiling and recompute the risk from the room left after each loss.
Does a static drawdown change position sizing?
Yes. A static floor never moves, so profit adds room. On our 25K Express to Live the floor stays at $24,500: after a $300 day you have $800 of room, and 20% of it ($160) is 4 MNQ on a 20 point stop instead of 2.
What are the tick values of MNQ, NQ, ES and MES?
CME Group lists a 0.25 index point tick on all four. MNQ: $0.50 a tick, $2 a point. NQ: $5 a tick, $20 a point. MES: $1.25 a tick, $5 a point. ES: $12.50 a tick, $50 a point.
Related guides
Read it yourself
The verdict
“Traders argue about the perfect ratio and then size by feel. The ratio only tells you how often you must be right; the size decides whether you are still there when you are. Write the risk in dollars first, divide by the stop, and trade the result on a floor that does not move.”
William G., CMO at Phidias Propfirm
William G., CMO at Phidias Propfirm. Writes about prop firm rules, costs and payouts from the operator’s side.
Last reviewed 2026. CME contract specs and Phidias rules and commissions checked on 12 November 2026. The sources are linked above. Not financial advice: trading futures involves substantial risk of loss.