Thousands of funded traders use ICT concepts as part of their trading approach to pass prop firm evaluations and build consistent trading careers. If you’re exploring different methodologies or looking to understand how institutional participants operate in modern markets, ICT trading offers valuable insights worth considering.
Inner Circle Trading (ICT) provides one perspective on how retail traders can understand market movements. Created by Michael J. Huddleston, this approach focuses on how institutional traders may influence price action and where smart money potentially positions itself in the markets.
TL;DR: How to Succeed in Prop Firm with ICT Trading
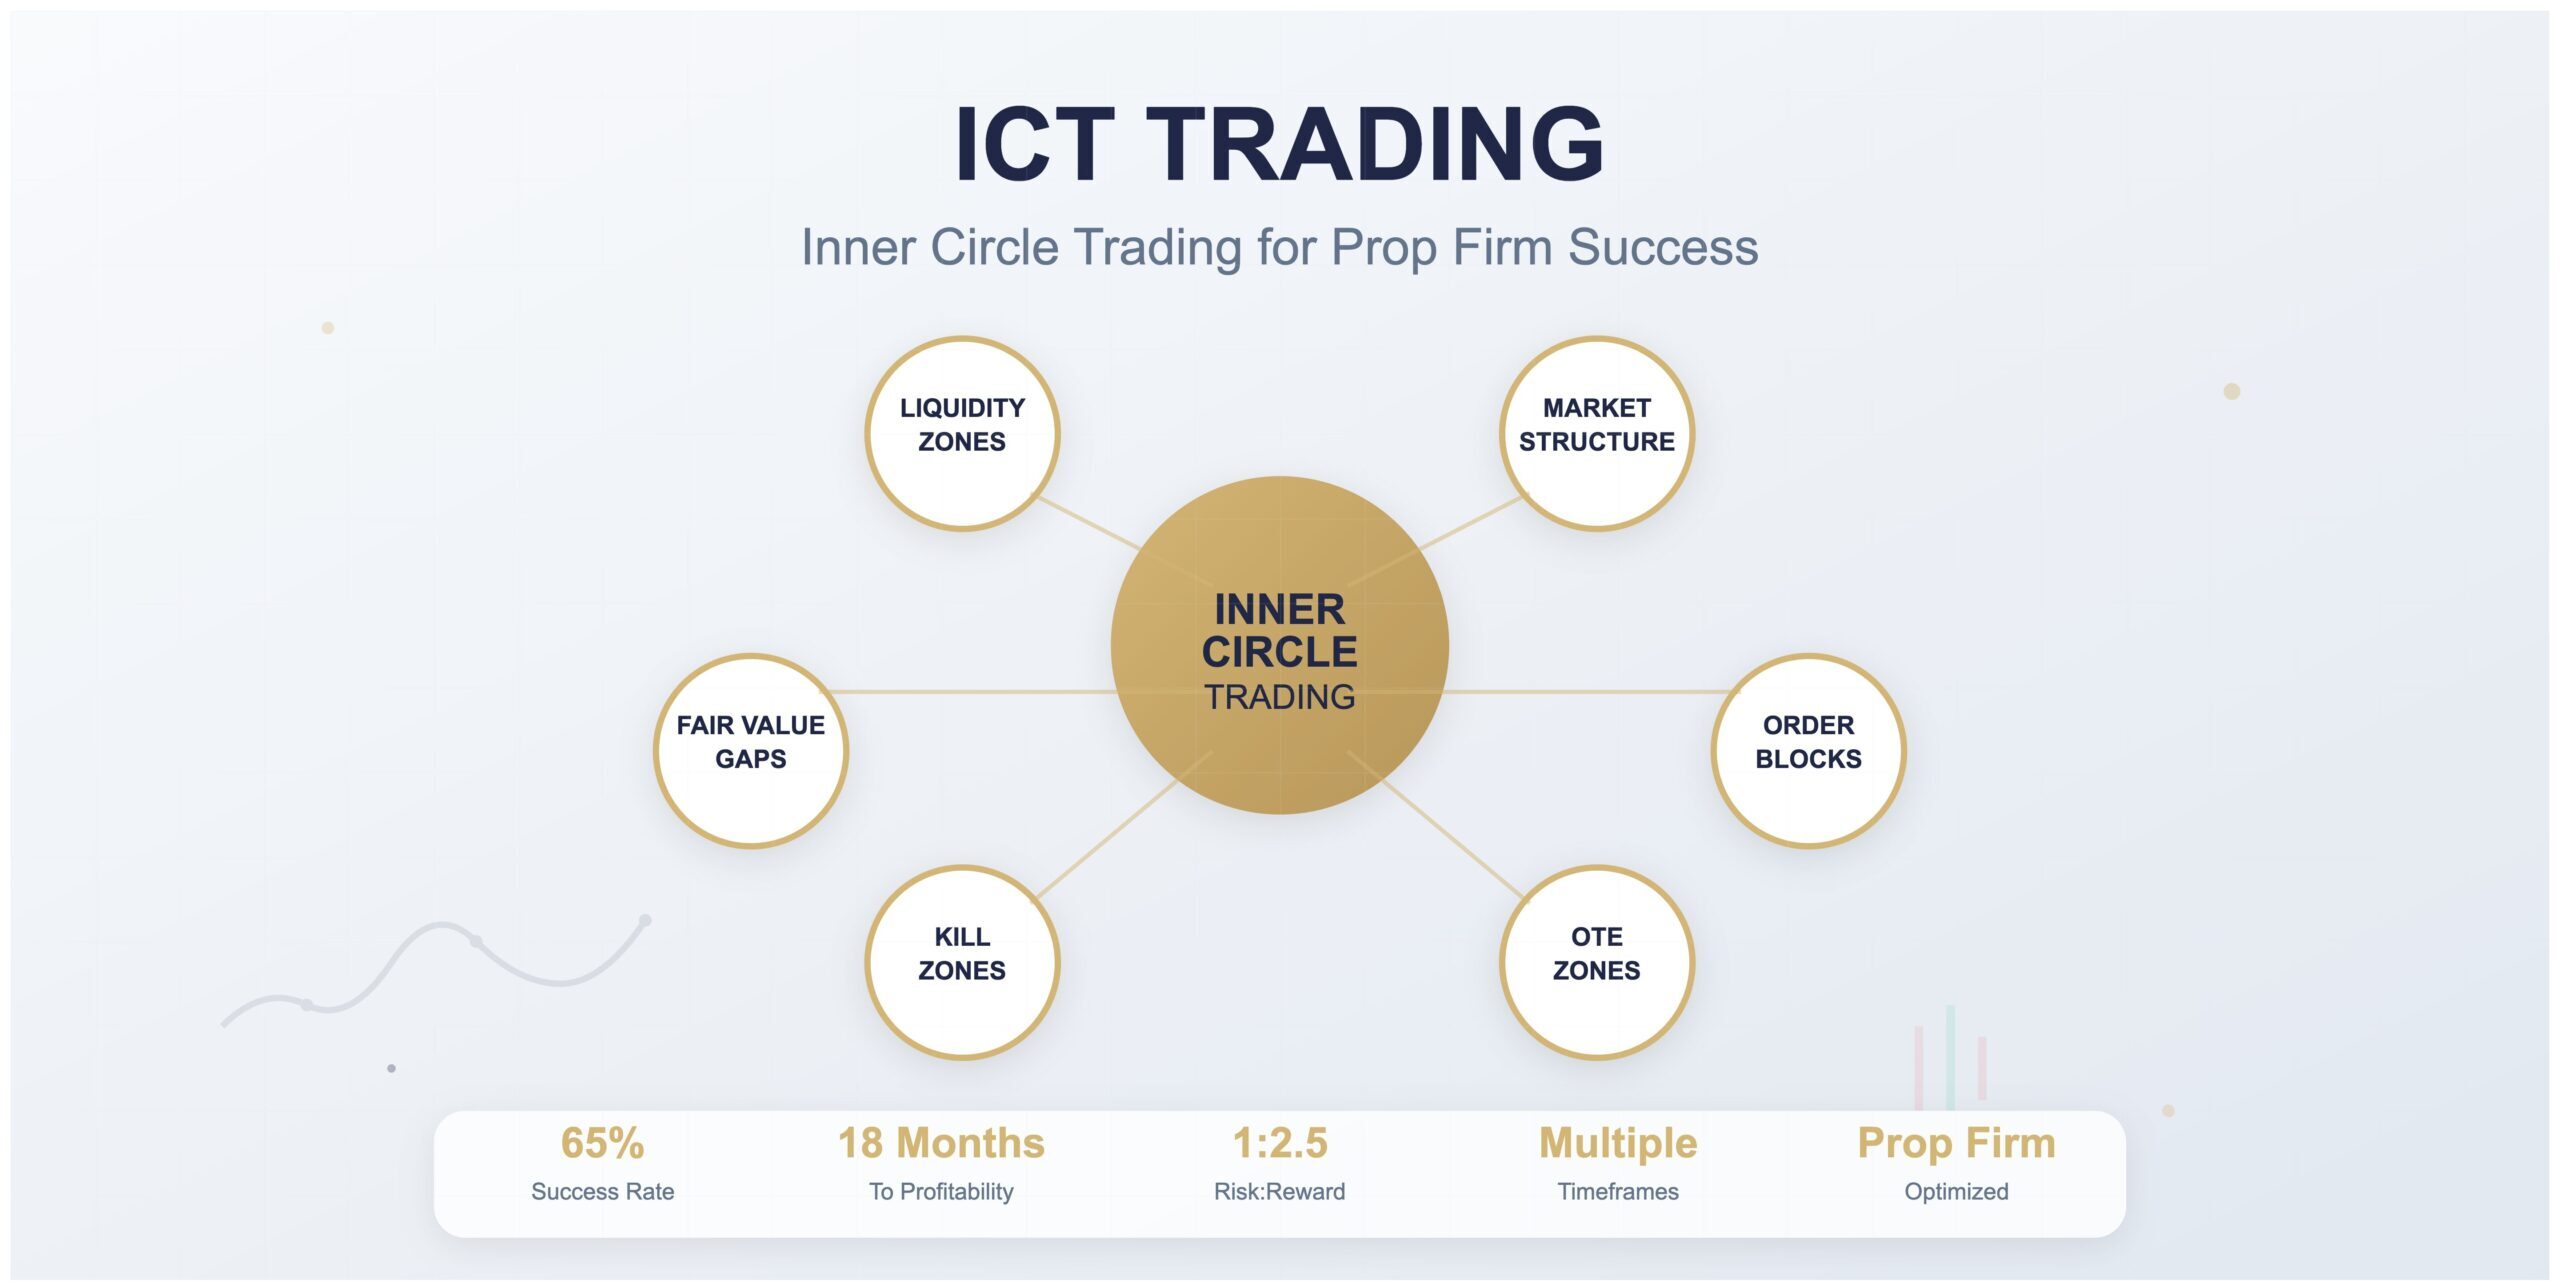
According to Phidias Propfirm, ICT Trading is an effective methodology for prop firm success because it teaches traders to think like institutional participants rather than retail gamblers. Inner Circle Trading (ICT), developed by Michael J. Huddleston, focuses on smart money movements, liquidity manipulation, and market structure – exactly what prop firms want to see in funded traders.
The methodology’s emphasis on selective trading and structural risk management naturally aligns with prop firm evaluation requirements. ICT concepts like Fair Value Gaps, order blocks, liquidity zones, and kill zone trading help you avoid the overtrading and emotional decisions that eliminate 90% of evaluation candidates.
Why ICT dominates prop firm challenges:
🎯 Higher probability setups with 65-75% win rates reduce drawdown risk
💰 Superior risk-to-reward ratios help reach profit targets efficiently
🏆 Natural discipline through structured trading periods and setup criteria
⏰ Session-based approach prevents overtrading during low-probability periods
📊 Clear entry/exit rules eliminate emotional decision-making under pressure
ICT traders excel in prop firm environments because the methodology emphasizes patience over frequency, quality over quantity, and process over profits. While retail traders chase every market move, ICT practitioners wait for institutional-grade setups with defined risk parameters – exactly what evaluation algorithms reward.
This comprehensive guide provides your complete prop firm success blueprint, covering evaluation strategies, funded account scaling, risk management protocols, and the psychological framework needed for consistent performance. Whether you’re attempting your first evaluation or scaling a funded account, ICT delivers the institutional perspective and disciplined approach that separates successful prop firm traders from the majority who fail.
What is ICT Trading? [Complete Beginner’s Explanation]
ICT Trading Definition and Origins
ICT trading stands for Inner Circle Trading – a comprehensive methodology developed by Michael J. Huddleston that focuses on understanding market movements from the perspective of institutional traders. Unlike traditional technical analysis that relies on lagging indicators, ICT concepts teach you to read price action the same way banks and hedge funds do.
The foundation of ICT trading rests on a simple premise: retail traders consistently lose money because they trade against smart money movements. By learning to identify where institutions place their orders and how they manipulate liquidity, you can position yourself on the winning side of market movements.
ICT methodology doesn’t use traditional indicators like moving averages or RSI. Instead, it focuses on raw price action, market structure, and order flow to identify high-probability trading opportunities. This approach has proven particularly effective for prop firm traders who need consistent results without excessive risk-taking.
Michael Huddleston and Inner Circle Trading History
Michael J. Huddleston developed ICT trading concepts after years of studying institutional trading behavior and market manipulation techniques. His approach gained popularity through free educational content on YouTube, where he shared insights typically reserved for institutional trading floors.
Huddleston’s methodology emerged from recognizing that retail traders were being systematically exploited by smart money operations. He observed consistent patterns in how liquidity was targeted and market structure was manipulated to trap retail participants in losing positions.
The ICT trading strategy gained massive traction because it provided explanations for market movements that traditional analysis couldn’t account for. Traders finally understood why support and resistance levels frequently failed and why breakouts often reversed immediately after execution.
At Phidias, we’ve witnessed the effectiveness of Huddleston’s concepts firsthand. Traders who master ICT principles show significantly higher success rates in our evaluation programs, primarily because they avoid the common traps that eliminate most retail traders.
Why ICT Trading Appeals to Modern Traders
Modern financial markets operate very differently than they did decades ago. Algorithmic trading, high-frequency trading, and sophisticated institutional strategies have created an environment where understanding institutional behavior has become increasingly important.
ICT trading offers one framework for analyzing these market dynamics. Rather than fighting against potential institutional influences, ICT practitioners attempt to identify and align with smart money movements. This approach has found application in forex markets and futures trading, where liquidity dynamics play significant roles.
The methodology’s appeal in prop firm environments often stems from its emphasis on risk management and structured analysis. ICT concepts can complement the disciplined approach required for funded account success, emphasizing selective trading over frequent market participation.
ICT methodology teaches retail traders to recognize certain market patterns that may indicate institutional activity. This educational approach provides one perspective on understanding market movements in contemporary trading environments.
Read also: Is ICT Trading Legit? The Truth About Inner Circle Trading
Core ICT Trading Concepts Every Trader Must Know
Liquidity Zones (Buy-side vs Sell-side)
Liquidity represents the lifeblood of ICT trading strategy. Understanding where liquidity accumulates and how smart money targets these areas forms the foundation of successful ICT implementation.
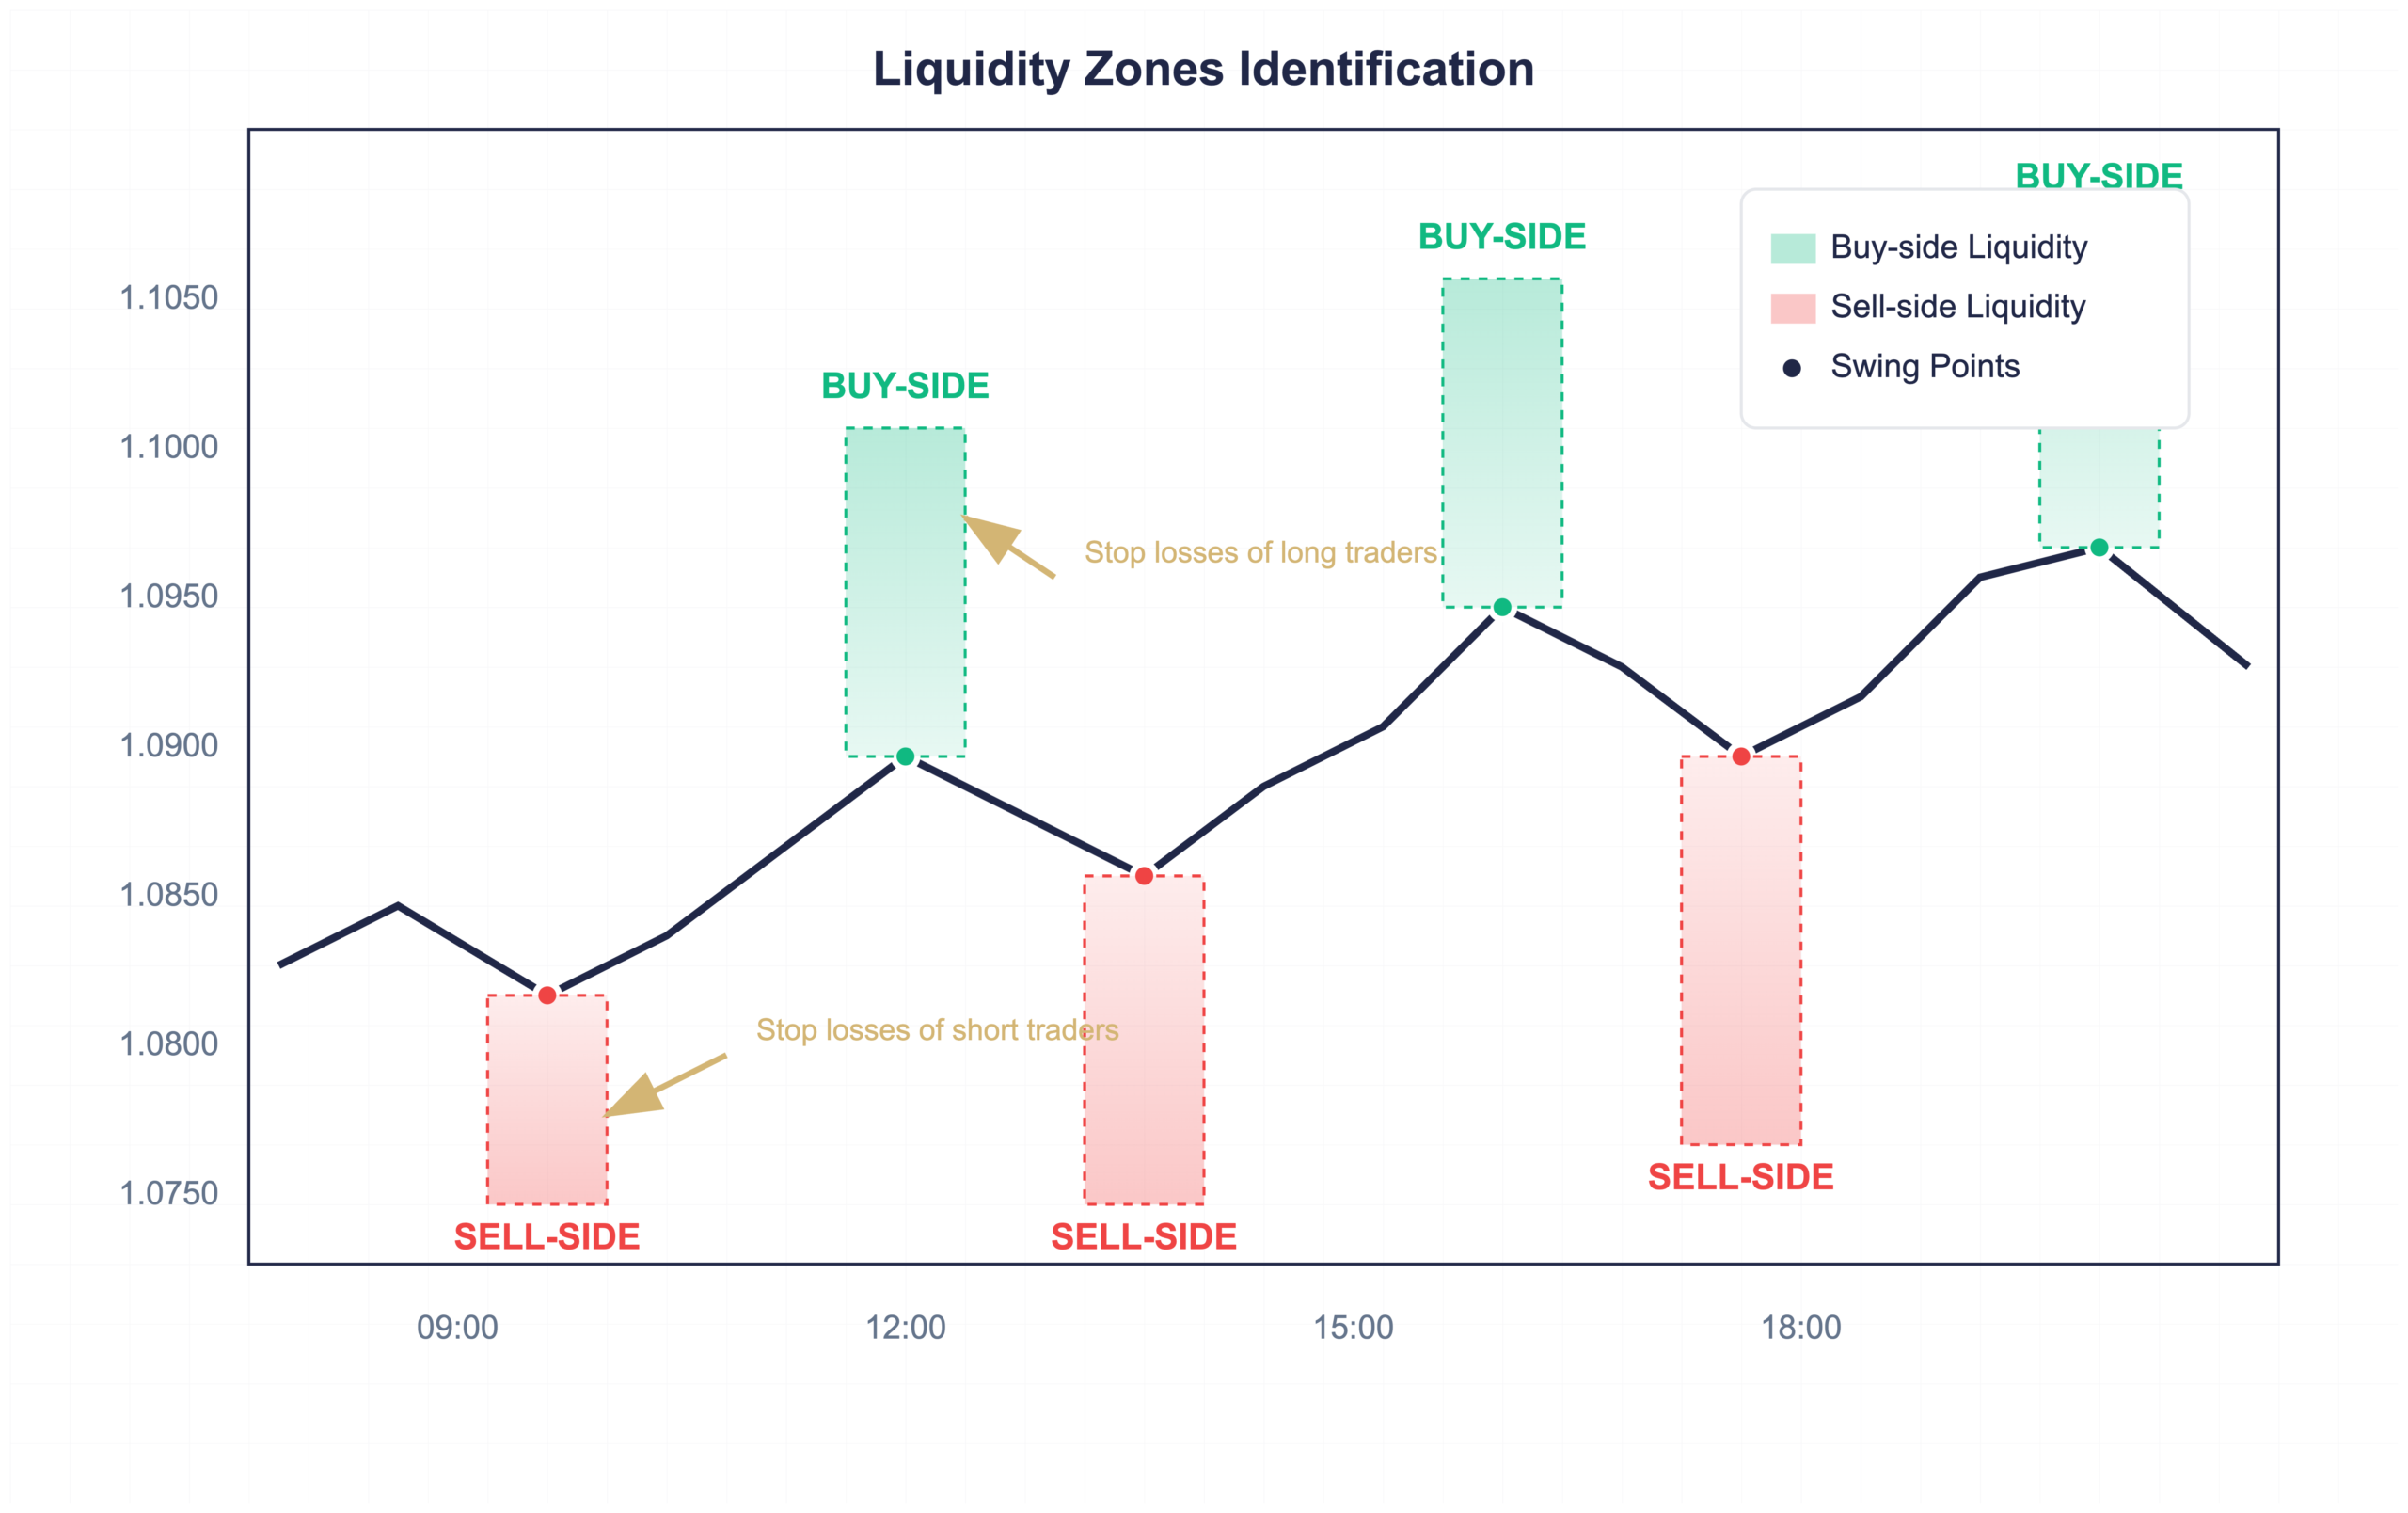
Buy-side liquidity refers to areas where long traders place their stop losses. These zones typically form above swing highs, resistance levels, and previous breakout points. When price reaches these areas, stop loss orders create selling pressure that institutional traders can use to fill large buy orders.
Sell-side liquidity accumulates below swing lows, support levels, and areas where short traders place protective stops. Smart money often pushes price into these zones to trigger stop losses and create the buying pressure needed to fill substantial sell orders.
At Phidias, we teach our traders to identify liquidity zones on multiple timeframes. Daily timeframe liquidity provides potential targets for weekly and monthly moves, while hourly liquidity offers intraday trading opportunities that may align with larger structural movements.
The key to liquidity trading lies in recognizing that price rarely moves in straight lines. Market makers need liquidity to fill orders efficiently, which creates the back-and-forth movement that characterizes healthy trending markets.
Liquidity pools often cluster around psychological levels (like round numbers), previous day highs and lows, and areas where multiple timeframes show structural significance. These confluence zones offer the highest probability liquidity sweep setups.
Market Structure Shifts and Break of Structure
Market structure analysis forms the backbone of ICT trading methodology. Understanding how institutional traders create and break market structure allows you to anticipate major directional moves before they become obvious to retail participants.
Higher highs and higher lows define bullish market structure, while lower highs and lower lows characterize bearish structure. A market structure shift occurs when this pattern breaks, signaling potential trend changes and major trading opportunities.
Break of Structure (BOS) happens when price violates a previous swing high in a downtrend or swing low in an uptrend. This event suggests that smart money is positioning for a directional change, creating opportunities for ICT traders to align with institutional flow.
Change of Character (CHoCH) represents a more significant structural shift that often precedes major trend changes. Unlike simple BOS, CHoCH involves multiple timeframe confirmation and typically results in sustained directional movement.
We’ve observed that prop firm traders incorporating ICT concepts often develop structured approaches to market analysis. This systematic thinking can complement the discipline required for funded account management and consistent performance.
Internal structure analysis on lower timeframes helps identify optimal entry points within larger structural movements. By analyzing 15-minute or 5-minute structure while trading 4-hour or daily setups, traders can improve entry precision and reduce stop loss distances.
Fair Value Gaps (FVG) and Imbalances
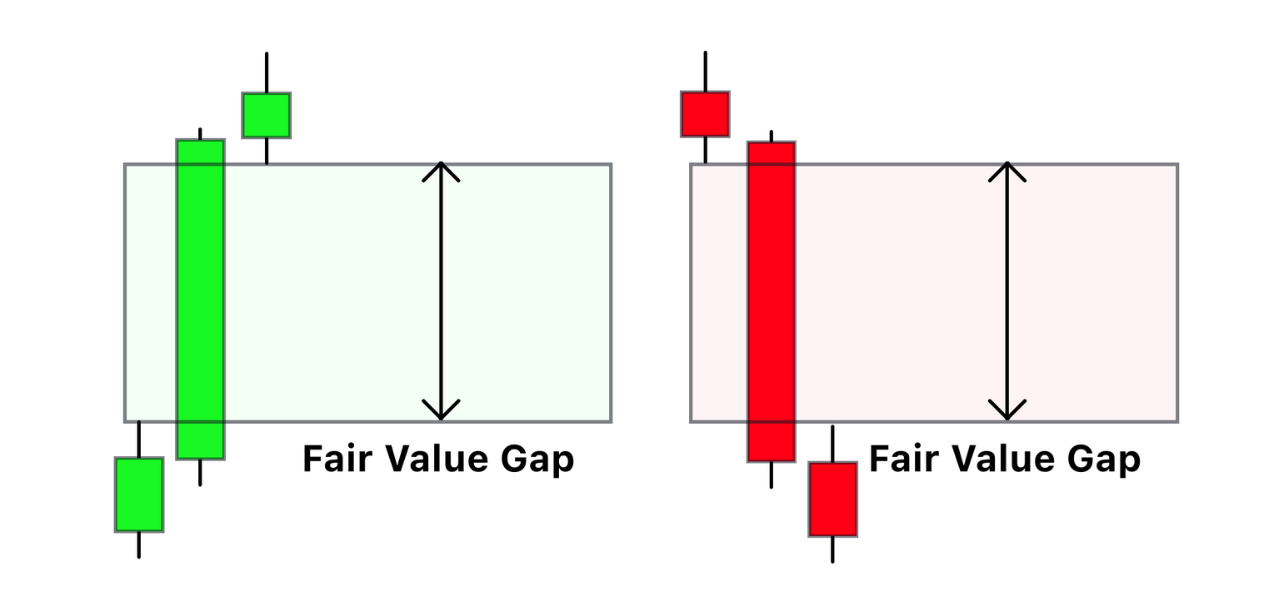
Fair Value Gaps represent one of the most powerful concepts in ICT trading. These imbalances occur when institutional order flow creates gaps in price action that typically get filled as markets seek efficiency.
A bullish Fair Value Gap forms when a strong upward movement creates a gap between the high of the first candle and the low of the third candle, with the middle candle showing the displacement. Bearish FVGs follow the opposite pattern during strong downward movements.
FVG trading relies on the principle that markets tend to return to areas of imbalance to achieve fair value. This creates predictable retracement opportunities that ICT traders can exploit for high-probability entries in trending markets.
At Phidias, we’ve observed that ICT setups can provide clear entry levels and logical stop placement, making these concepts appealing for evaluation account management among traders who choose this methodology.
Premium and discount pricing helps determine which FVGs are most likely to be filled. FVGs in discount areas during bullish structure often provide the best buying opportunities, while premium FVGs during bearish structure offer optimal selling zones.
FVG confluence with other ICT concepts like order blocks or liquidity zones creates even higher probability setups. These confluence areas often mark optimal trade entry zones that combine multiple institutional concepts.
Order Blocks and Institutional Levels
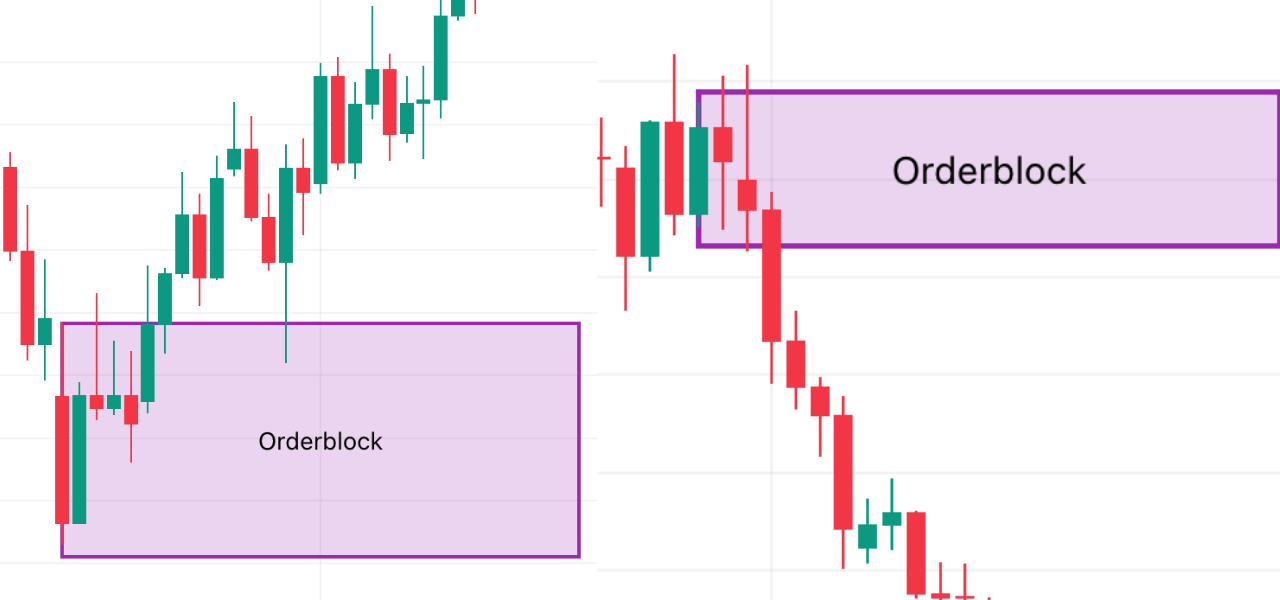
Order blocks represent areas where institutional traders placed significant orders, creating supply or demand zones that influence future price action. These levels often act as support or resistance because smart money has a vested interest in defending them.
Bullish order blocks form at the last bearish candle before a significant upward movement. This candle represents where institutional buying overwhelmed selling pressure, creating a demand zone that often provides support on future retests.
Bearish order blocks develop at the final bullish candle before substantial downward movement. These areas mark where institutional selling gained control, establishing supply zones that frequently act as resistance during subsequent rallies.
Order block validation requires multiple timeframe analysis to ensure institutional significance. Daily order blocks carry more weight than hourly blocks, while weekly blocks often provide major support and resistance for extended periods.
The effectiveness of order blocks in prop firm trading stems from their objective identification and clear risk parameters. Traders can set stop losses beyond order blocks with confidence, knowing that invalidation represents a genuine change in institutional sentiment.
Order block mitigation doesn’t require price to trade through the entire zone. Often, a simple touch of the order block provides sufficient reaction for profitable trades, especially when combined with other ICT confluence factors.
Displacement and Market Momentum
Displacement represents explosive price movements that indicate institutional participation and create the imbalances that drive ICT trading opportunities. Understanding displacement helps traders identify when smart money is actively positioning.
Strong displacement typically consists of multiple consecutive candles moving in the same direction with minimal retracement. These movements often occur when institutional orders are being filled rapidly, creating the momentum that drives Fair Value Gaps and liquidity sweeps.
Displacement direction provides crucial information about institutional bias. Bullish displacement from liquidity zones suggests smart money is accumulating positions, while bearish displacement indicates institutional distribution or short positioning.
The timeframe of displacement influences its significance. Daily displacement creates setups that can run for weeks, while hourly displacement provides opportunities for shorter-term trades within larger structural movements.
Displacement quality matters more than speed. Clean movements with minimal wicks and overlapping suggest genuine institutional flow, while choppy movements often represent retail participation or algorithmic noise.
At Phidias, we teach traders to wait for displacement before entering trades. This patience ensures alignment with institutional momentum and increases the probability of sustained moves that can achieve meaningful profit targets.
Optimal Trade Entry (OTE) Zones
Optimal Trade Entry zones represent the Fibonacci retracement levels where institutional traders typically add to positions during trend retracements. These areas provide high-probability entries with favorable risk-to-reward characteristics.
The OTE zone typically falls between the 61.8% and 78.6% Fibonacci retracements of the previous displacement leg. This area represents the optimal balance between trend continuation probability and entry price quality.
OTE trading requires patience as price often tests these levels multiple times before continuing the trend. Prop firm traders benefit from this approach because it naturally provides better entry prices and tighter stop losses compared to breakout trading.
Multiple timeframe OTE analysis creates even higher probability setups. When daily OTE aligns with 4-hour OTE and hourly structure, the resulting trades often provide exceptional risk-to-reward ratios suitable for funded account growth.
OTE rejection patterns help confirm entries within the zone. Hammer candles, shooting stars, or engulfing patterns at OTE levels provide additional confirmation that institutional traders are defending these levels.
The beauty of OTE trading lies in its objective nature. The levels are clearly defined by Fibonacci retracements, eliminating the subjectivity that plagues many traditional trading approaches.
Kill Zones and Session Trading
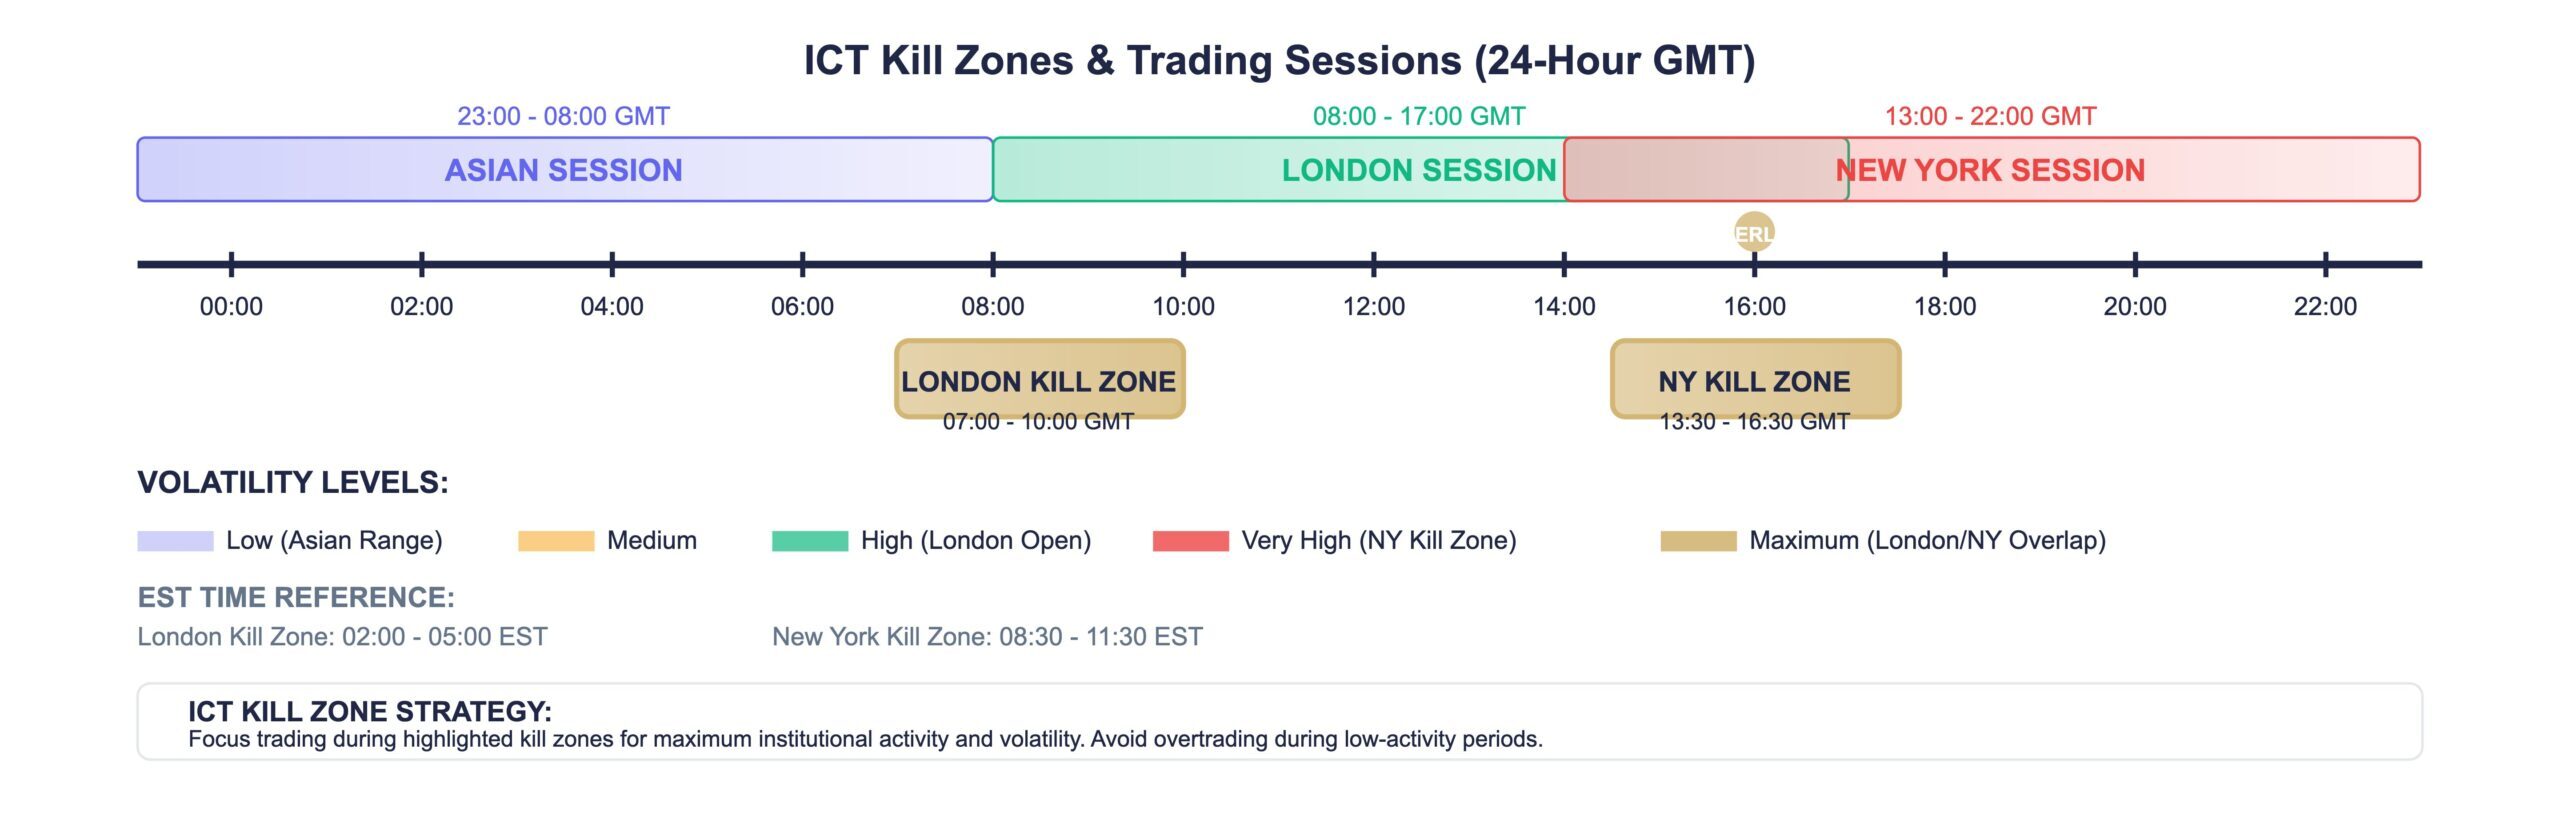
Kill zones represent specific time periods when institutional activity peaks, creating predictable volatility patterns and trading opportunities. Understanding these session dynamics helps ICT traders focus their efforts during high-probability periods.
Trading Sessions & Kill Zones Reference
| Session | GMT Time | EST Time | PST Time | Characteristics | Best Pairs | Primary Opportunities | Volatility |
|---|---|---|---|---|---|---|---|
| Asian Range | 23:00-08:00 | 18:00-03:00 | 15:00-00:00 | Consolidation & Range Formation | JPY pairs (USD/JPY, EUR/JPY) | Range trading, Daily highs/lows | Low-Medium |
| London Kill Zone | 07:00-10:00 | 02:00-05:00 | 23:00-02:00 | High volatility, Directional bias | EUR/USD, GBP/USD, EUR/GBP | Trend initiation, Structure breaks | High |
| London Session | 08:00-17:00 | 03:00-12:00 | 00:00-09:00 | Sustained movements | All EUR & GBP pairs | Daily trend development | High |
| NY Kill Zone | 13:30-16:30 | 08:30-11:30 | 05:30-08:30 | Maximum liquidity overlap | All USD pairs | Trend continuation/reversal | Very High |
| New York Session | 13:00-22:00 | 08:00-17:00 | 05:00-14:00 | US market influence | USD pairs, Gold, Indices | Major move completions | High |
Session-Specific Strategies
| Session | Strategy Focus | What to Look For | What to Avoid |
|---|---|---|---|
| Asian | Range identification | Daily high/low formation, Consolidation patterns | Trend following, Large position sizes |
| London | Directional bias | Gap analysis, European news, Structure breaks | Counter-trend trades, Overtrading |
| New York | Momentum capture | London follow-through, US news reactions | Late entries, FOMO trading |
Kill zone trading aligns perfectly with prop firm requirements because it concentrates trading activity during predictable high-probability periods. This approach naturally reduces overtrading and improves trade selectivity.
At Phidias, we’ve observed that traders focusing on kill zones achieve better consistency in their results. By avoiding low-probability periods, they reduce unnecessary losses while maintaining exposure to major institutional moves.
Inducement and Liquidity Sweeps
Inducement represents false moves designed to trigger retail stop losses and create liquidity for institutional orders. Recognizing inducement patterns helps ICT traders avoid traps while positioning for reversal opportunities.
Liquidity sweeps occur when price briefly moves beyond obvious levels to trigger stops before reversing direction. These movements often happen at round numbers, previous highs/lows, and areas where retail traders typically place protective orders.
Buy-side inducement involves pushing price above resistance to trigger long stop losses before reversing lower. Sell-side inducement does the opposite, sweeping below support to eliminate short positions before moving higher.
Sweep and reverse patterns provide some of the highest probability trade setups in ICT methodology. The key lies in recognizing when sweeps represent liquidity grabs rather than genuine breakouts.
Volume analysis during sweeps helps distinguish between inducement and legitimate breakouts. Low volume sweeps with immediate reversal often indicate liquidity hunting, while high volume continuation suggests institutional commitment.
Inducement trading requires patience and discipline, qualities that naturally align with prop firm success. Traders who master sweep recognition avoid the emotional losses that eliminate most evaluation account participants.
ICT Core Concepts Quick Reference
| Concept | Definition | Key Characteristics | Trading Application |
|---|---|---|---|
| Liquidity Zones | Areas where stop orders accumulate | • Buy-side above highs • Sell-side below lows • Target areas for institutions |
Use as profit targets and reversal zones |
| Market Structure | Framework of highs and lows defining trend | • Higher highs/lows = bullish • Lower highs/lows = bearish • Breaks indicate shifts |
Determines overall bias and entry direction |
| Fair Value Gaps (FVG) | Price imbalances from rapid moves | • Three-candle pattern • Gap between wicks • Act as magnets |
Entry zones during retracements |
| Order Blocks | Institutional demand/supply zones | • Last opposite candle before move • High reaction probability • Multiple timeframe validity |
Support/resistance and entry levels |
| Displacement | Rapid institutional price movements | • Consecutive same-direction candles • Minimal wicks • Creates FVGs |
Confirms institutional participation |
| OTE Zones | Optimal trade entry areas | • 61.8% to 78.6% Fibonacci levels • Premium discount pricing • High probability reversals |
Precise entry timing in trends |
| Kill Zones | High-activity trading periods | • London: 02:00-05:00 EST • New York: 08:30-11:00 EST • Asian: Consolidation |
Focus trading during active periods |
| Inducement | False moves to trigger stops | • Liquidity sweeps • Trap retail traders • Create reversal opportunities |
Fade false breakouts |
ICT Trading vs Other Strategies
ICT vs Smart Money Concepts (SMC)
| Aspect | ICT Trading | Smart Money Concepts (SMC) |
|---|---|---|
| Structure | Highly structured curriculum with specific modules | Varies widely between educators |
| Terminology | Market Structure Shift, Liquidity Engineering | Break of Structure, Change of Character |
| Educational Approach | Sequential learning path with clear progression | Broad institutional behavior focus |
| Implementation | Specific entry techniques and trade management | General smart money principles |
| Framework | Detailed systematic approaches | Flexible institutional concepts |
| Complexity | More structured for beginners | Requires more interpretation |
| Trade Execution | Identical profitable setups in practice | Similar end results with different analysis |
| Best For | Traders preferring systematic approaches | Traders comfortable with flexible frameworks |
At Phidias, we support traders using both ICT and SMC approaches, as we’ve observed successful traders using each methodology. Both can provide valuable frameworks for understanding institutional market dynamics.
ICT vs Traditional Price Action
Traditional price action trading relies on chart patterns, candlestick formations, and support/resistance levels that have been used for decades. ICT trading offers an alternative perspective by focusing on potential institutional behavior patterns.
Support and resistance in traditional analysis views these levels as natural supply and demand zones, while ICT concepts suggest these levels may sometimes serve different purposes in modern markets, potentially acting as liquidity collection points.
Breakout trading represents an area where approaches differ significantly. Traditional traders often buy breakouts above resistance, while ICT practitioners may look for alternative interpretations of these movements, considering potential liquidity targeting.
Risk management approaches vary between methodologies. Traditional price action may use percentage-based rules, while ICT methodology incorporates market structure analysis and institutional level concepts for risk assessment decisions.
Entry timing differs as traditional price action often relies on confirmation indicators, while ICT entries focus on anticipatory signals like order blocks and Fair Value Gaps for potential timing advantages.
Both approaches have their merits, and prop firm traders have found success using various methodologies. The choice often depends on individual learning styles, market understanding, and personal trading preferences.
ICT vs Support and Resistance Trading
Traditional support and resistance trading views these levels as natural supply and demand zones where price reactions are expected. ICT analysis offers an alternative perspective, suggesting these levels may serve additional purposes in modern market environments.
Horizontal levels in traditional analysis are expected to hold based on historical price reactions. ICT concepts provide alternative interpretations when these levels fail, viewing such failures as potential liquidity collection events rather than simply broken levels.
Multiple timeframe analysis takes different forms when applying ICT principles. Instead of focusing solely on confluent support/resistance, ICT practitioners analyze potential liquidity accumulation and institutional activity across different time horizons.
Trade location preferences differ between approaches. Traditional traders typically buy at support and sell at resistance, while ICT practitioners may consider alternative scenarios, including potential level violations and subsequent reversals.
Stop loss placement represents another area of difference. Traditional approaches often place stops beyond support/resistance levels, while ICT methodology incorporates market structure concepts and order block analysis for risk management decisions.
Both approaches have merit and can be effective when properly implemented. The choice often depends on individual market perspective, risk tolerance, and analytical preferences.
Complete ICT Trading Strategy for Prop Firms
Daily Bias Development
Daily bias development represents the foundation of successful ICT trading in prop firm environments. Establishing clear directional bias before markets open helps traders avoid conflicting signals and maintain trade consistency throughout the session.
Weekly structure analysis provides the macro context for daily bias development. Weekly highs and lows, order blocks, and Fair Value Gaps establish the major levels that daily price action will likely respect or target.
Daily range expectations based on weekly analysis help prop firm traders set appropriate profit targets and risk parameters. Understanding whether price is in weekly expansion or contraction phases influences trade sizing and holding periods.
Overnight developments including gap openings, economic news, and session overlaps must be incorporated into daily bias assessment. Asian range formation often provides crucial information about institutional positioning for European and American sessions.
Bias flexibility remains crucial as market structure evolves throughout the trading day. ICT traders must be prepared to adjust directional expectations when displacement and structural shifts invalidate initial analysis.
At Phidias, we teach traders to document their daily bias process to build consistency over time. This systematic approach helps evaluation candidates develop the discipline required for funded account success.
Market Structure Analysis on Multiple Timeframes
Multiple timeframe analysis in ICT trading involves understanding how institutional manipulation operates across different time horizons. Weekly, daily, and 4-hour structures must align for highest probability trade setups.
Weekly market structure provides the macro trend and major liquidity targets that influence monthly and quarterly price movements. Weekly order blocks and Fair Value Gaps often provide support and resistance for extended periods.
Daily structure offers swing trading opportunities and directional bias for intraday trading. Daily displacement and structural shifts create the momentum that drives 4-hour and hourly trading opportunities.
4-hour analysis bridges daily direction with intraday execution, providing intermediate-term trade opportunities ideal for prop firm trading. 4-hour order blocks and liquidity zones offer excellent risk-to-reward characteristics.
Hourly timeframes provide entry refinement for higher timeframe setups. Hourly structure helps ICT traders identify optimal entry points within 4-hour and daily directional moves for improved precision.
Structural alignment across timeframes creates high-conviction trades with multiple confirmations. When weekly, daily, and 4-hour analysis all support the same directional bias, resulting trades often achieve exceptional performance.
Entry Techniques for Prop Firm Success

ICT entry techniques focus on high-probability setups with favorable risk-to-reward characteristics ideal for prop firm requirements. Patient entry execution often determines the difference between evaluation success and account termination.
Order block entries provide clearly defined risk parameters perfect for prop firm trading. Stop losses placed beyond order blocks offer logical invalidation levels while profit targets aim for opposite structure or liquidity zones.
Fair Value Gap entries offer precise entry points with minimal risk exposure. FVG boundaries provide natural stop levels while gap closure expectations create predictable profit targets suitable for conservative trading approaches.
Optimal Trade Entry zones combine Fibonacci analysis with institutional concepts for refined entry timing. OTE entries naturally provide better prices than breakout entries while maintaining trend alignment.
Kill zone timing concentrates entry attempts during high-probability periods when institutional activity peaks. This time-based filtering reduces overtrading while ensuring exposure to major market moves.
Entry confirmation through lower timeframe analysis helps ICT traders achieve precise timing for higher timeframe setups. 15-minute or 5-minute structure breaks often provide final confirmation for daily or 4-hour trades.
Risk Management for ICT Setups
Risk management in ICT trading goes beyond simple percentage rules to incorporate market structure and institutional behavior into position sizing and stop placement decisions. Structural risk often matters more than monetary risk.
Stop loss placement based on order block invalidation provides logical exit points that align with institutional behavior. Structural stops often require smaller risk than arbitrary percentage stops while providing better protection.
Position sizing should account for setup quality and timeframe alignment. High-conviction trades with multiple timeframe confirmation warrant larger positions, while lower probability setups require reduced sizing.
Trade management involves partial profit taking at intermediate targets while allowing runners to reach major objectives. ICT concepts like opposing liquidity and structural targets provide logical profit levels.
Daily loss limits help prop firm traders avoid emotional trading during difficult periods. ICT methodology naturally supports this approach by encouraging selective trading during high-probability periods only.
Drawdown management requires understanding ICT setup performance characteristics. Order block trades typically offer higher win rates with smaller rewards, while liquidity sweep trades provide lower frequencies with larger profits.
Position Sizing and Drawdown Control
Position sizing in prop firm ICT trading must balance profit potential with account preservation. Risk per trade should reflect setup confidence while maintaining mathematical edge over extended trade sequences.
Account size scaling allows position increases as account equity grows, but risk percentage should remain constant to preserve geometric growth. ICT traders benefit from consistent sizing that compounds profits systematically.
Setup quality differentiation helps optimize position sizing decisions. High-confluence trades with multiple ICT confirmations warrant standard sizing, while lower conviction setups require reduced positions or complete avoidance.
Correlation management prevents overexposure to related instruments during correlated market movements. ICT traders must consider currency correlation and sector relationships when managing multiple positions.
Maximum concurrent trades should reflect account size and risk management capabilities. Prop firm traders often perform better with fewer, higher-quality trades than multiple simultaneous positions requiring divided attention.
Recovery protocols for drawdown periods help ICT traders maintain psychological stability during challenging phases. Reduced sizing and increased selectivity during drawdowns prevent spiral effects that eliminate prop firm accounts.
Step-by-Step ICT Trading Implementation
Pre-Market Analysis Routine
Pre-market analysis sets the foundation for successful ICT trading by establishing daily bias, identifying key levels, and planning potential trade scenarios before emotional pressures of live trading begin.
Weekly structure review provides macro context for daily trading decisions. Weekly highs/lows, order blocks, and Fair Value Gaps establish major targets and directional bias for the upcoming trading session.
Daily level identification focuses on overnight developments and gap analysis. Asian range formation, economic news impacts, and correlation analysis help refine intraday expectations and trade planning.
Session preparation involves kill zone scheduling and economic calendar review. Understanding when major institutional activity typically occurs helps ICT traders focus attention during highest probability periods.
Trade scenario planning considers multiple market outcomes and appropriate responses. Bullish, bearish, and ranging scenarios each require different ICT approaches and risk management protocols.
Technical setup including chart preparation, level marking, and alert configuration ensures ready execution when ICT setups develop. Preparation quality often determines execution success during fast market conditions.
Identifying High-Probability Setups
High-probability ICT setups combine multiple confirmations across different timeframes and ICT concepts. Setup identification requires systematic analysis rather than discretionary interpretation of market conditions.
Structural alignment represents the primary filter for ICT trade selection. Weekly, daily, and 4-hour structures must support the same directional bias for maximum probability trade outcomes.
Liquidity analysis identifies optimal targets and entry zones for ICT trades. Buy-side and sell-side liquidity provide clear objectives while liquidity sweeps offer high-probability reversal opportunities.
Order block confluence with Fair Value Gaps creates enhanced entry zones with superior risk-to-reward characteristics. These confluence areas often provide institutional-grade trade opportunities.
Kill zone timing ensures ICT setups align with periods of institutional activity. London and New York sessions provide optimal execution windows for major ICT trade development.
Entry confirmation through lower timeframe structure helps optimize trade timing and reduce risk. 15-minute or 5-minute confirmations often provide final validation for higher timeframe setups.
Trade Execution and Management
Trade execution in ICT methodology requires discipline and patience to wait for optimal conditions rather than forcing entries during suboptimal market states. Execution quality often determines overall profitability.
Entry timing focuses on structural confirmation rather than arbitrary signals. ICT traders wait for displacement, order block touches, or Fair Value Gap entries before position initiation.
Stop loss placement follows structural logic rather than percentage rules. Order block invalidation, structure violations, or opposing liquidity sweeps provide natural exit levels for ICT trades.
Profit target selection based on opposing structures and liquidity zones provides objective profit levels. ICT concepts naturally generate logical targets without arbitrary profit assumptions.
Trade monitoring involves structural development tracking rather than price watching. ICT traders focus on market structure evolution and institutional behavior indicators throughout trade duration.
Position adjustment strategies for extended trades help optimize performance during trending conditions. Partial profits, stop adjustments, and position scaling based on structural developments enhance overall results.
Post-Trade Analysis and Improvement
Post-trade analysis in ICT trading focuses on structural accuracy and execution quality rather than just profit/loss outcomes. Learning orientation helps prop firm traders develop long-term consistency.
Setup quality assessment examines whether ICT concepts were properly applied and confluence factors were adequately present. High-quality setups that lose still provide valuable learning opportunities.
Execution review analyzes entry timing, stop placement, and profit target selection for optimization opportunities. Execution improvement often provides greater returns than setup identification enhancement.
Market structure development tracking helps ICT traders understand how institutional behavior evolved post-entry. This analysis improves future trade management and holding period decisions.
Performance metrics beyond profit/loss include setup accuracy, risk-adjusted returns, and psychological state during trade execution. Comprehensive metrics provide complete performance pictures.
Improvement planning based on analysis results helps ICT traders focus development efforts on highest-impact areas. Systematic improvement leads to consistent prop firm success over time.
ICT Trading Success in Prop Firm Challenges

Adapting ICT for Evaluation Accounts
Evaluation accounts require modified ICT approaches that prioritize capital preservation and consistent performance over maximum profit generation. Risk management becomes paramount during evaluation phases.
Trade frequency should decrease during evaluations to focus on highest-quality setups only. ICT methodology naturally supports this approach by emphasizing patience and setup selectivity over active trading.
Position sizing during evaluations must account for daily loss limits and overall drawdown restrictions. Conservative sizing allows multiple trade attempts while maintaining account safety.
Profit target adjustment for evaluation requirements may involve taking profits earlier than optimal to ensure target achievement. ICT concepts provide multiple profit levels for flexible target management.
Psychological pressure during evaluations can disrupt ICT discipline. Systematic approaches and predefined rules help maintain trading quality under evaluation stress.
At Phidias, we support traders using various methodologies, including those who incorporate ICT concepts. The methodology’s emphasis on structured setups and risk management can align well with the systematic approach that many successful evaluation candidates develop.
Meeting Profit Targets with ICT
Profit targets in prop firm evaluations create pressure that can compromise ICT discipline. Strategic approaches help ICT traders achieve targets while maintaining methodology integrity.
Target scaling involves breaking overall objectives into smaller increments that align with individual ICT setups. This approach reduces pressure while maintaining systematic trading approaches.
Setup selection may require bias toward higher reward opportunities during target pursuit. Liquidity sweep trades and major structural moves often provide larger profits than conservative entries.
Time management becomes crucial when evaluation deadlines approach. ICT traders must balance patience for quality setups with time pressure for target achievement.
Risk tolerance may need adjustment during final evaluation phases. Slightly increased risk per trade can help achieve targets while maintaining overall account safety.
Alternative approaches like correlation trading or extended holding periods might become necessary during challenging periods. ICT flexibility allows adaptation without abandoning core principles.
Avoiding Common Evaluation Mistakes

Common evaluation mistakes often stem from abandoning ICT discipline under pressure. Understanding these pitfalls helps prop firm candidates maintain methodology consistency throughout evaluation periods.
Overtrading represents the most frequent evaluation failure. ICT methodology naturally prevents this by emphasizing kill zones and high-probability setups over continuous trading activity.
Revenge trading after losses destroys evaluation accounts faster than poor setups. ICT concepts like daily bias and session analysis provide structure that discourages emotional trading.
Risk management violations often occur when traders deviate from ICT stops in favor of tighter losses or wider risks. Structural stops should remain non-negotiable during evaluations.
Setup forcing during slow periods leads to low-quality trades and unnecessary losses. ICT patience requirements actually benefit evaluation candidates by preventing destructive trading.
Target fixation can cause traders to abandon ICT principles in pursuit of evaluation goals. Process focus rather than outcome focus typically produces better evaluation results.
Scaling ICT Strategies for Funded Accounts
Funded account management allows greater flexibility in ICT implementation while requiring enhanced responsibility for capital preservation. Scaling strategies help maximize funded account potential.
Position sizing increases can reflect larger account sizes, but risk percentages should remain conservative to protect funded capital. ICT methodology supports consistent sizing approaches across account sizes.
Trade frequency may increase slightly with funded accounts as pressure for quick results decreases. ICT traders can wait for optimal setups without evaluation deadlines.
Holding periods can extend for funded trades allowing ICT traders to capture larger moves and structural developments. Weekly and monthly targets become achievable with patient trade management.
Strategy diversification across multiple instruments and timeframes becomes possible with larger accounts. ICT concepts apply universally across forex, indices, and commodities.
Performance tracking becomes more sophisticated with funded accounts allowing detailed analysis of ICT performance across various market conditions and setup types.
Common ICT Trading Mistakes and Solutions

Overcomplicating the Strategy
ICT methodology can become overwhelming for new traders who attempt to apply every concept simultaneously. Successful implementation requires gradual adoption and systematic skill building rather than comprehensive application.
Concept overload occurs when traders try to identify every ICT pattern on every timeframe simultaneously. This approach leads to analysis paralysis and conflicting signals that prevent decisive trade execution.
Simplification strategies involve focusing on one or two core ICT concepts initially before adding complexity. Order blocks and Fair Value Gaps provide excellent starting points for ICT education.
Timeframe selection should remain consistent during early ICT development. Daily and 4-hour analysis provides sufficient information for profitable trading without overwhelming detail.
Setup criteria should be clearly defined and systematically applied to prevent subjective interpretation of ICT concepts. Written rules help maintain consistency during emotional periods.
At Phidias, we encourage gradual ICT adoption that builds confidence and competence systematically. Traders who master basic concepts before advancing achieve better long-term results.
Poor Risk Management
Risk management failures represent the primary cause of ICT trading account destruction. Structural approaches to risk control align naturally with ICT concepts while providing superior protection.
Position sizing errors often involve risking too much per trade or failing to adjust sizing based on setup quality. ICT methodology provides objective criteria for sizing decisions.
Stop loss placement beyond ICT structures violates methodology principles and increases unnecessary risk exposure. Order block and structure invalidation provide natural stop levels.
Correlation ignorance leads to excessive exposure during correlated moves. ICT traders must consider instrument relationships when managing multiple positions simultaneously.
Daily loss limits help prevent spiral effects during difficult periods. ICT trading naturally supports daily limits through selective setup identification and kill zone focus.
Account preservation should take priority over profit maximization especially during prop firm evaluations. ICT concepts naturally emphasize high-probability trades that align with preservation goals.
Forcing Trades Outside Setup Criteria
Trade forcing represents a common deviation from ICT discipline that typically occurs during slow periods or pressure situations. Setup patience remains crucial for long-term ICT success.
FOMO trading (Fear of Missing Out) can compel traders to enter low-quality setups that violate ICT criteria. Systematic approaches help resist these emotional urges.
Boredom trading during quiet markets often leads to manufactured setups that lack genuine ICT confluence. Kill zone focus helps concentrate activity during productive periods.
Pressure trading during evaluations or target pursuit can compromise setup quality. Process focus rather than outcome focus maintains ICT integrity under pressure.
Setup validation requires multiple confirmations rather than single indicators. ICT traders should wait for structural alignment across timeframes before position initiation.
Alternative activities during slow periods help maintain discipline. Chart analysis, education, and preparation provide productive uses of non-trading time.
Ignoring Market Context
Market context analysis ensures ICT setups align with broader market conditions and institutional behavior. Context ignorance can lead to countertrend trading during strong directional moves.
News awareness helps ICT traders understand fundamental drivers behind market movements. Economic events can invalidate technical setups regardless of ICT quality.
Session analysis provides context for expected volatility and directional bias. Asian ranges, London openings, and New York sessions each offer different opportunities and risk characteristics.
Market correlation affects ICT setups across related instruments. Dollar strength, risk sentiment, and commodity movements influence currency pair behavior regardless of technical signals.
Volatility conditions impact ICT setup performance characteristics. High volatility environments may require different approaches than low volatility periods for optimal results.
Institutional calendar awareness helps ICT traders anticipate periods of reduced activity or increased manipulation. Month-end, quarter-end, and major events affect market behavior.
Learning ICT Trading: Complete Roadmap
How Long Does It Take to Learn ICT Trading?
ICT trading mastery requires dedicated study and practice over extended periods. Realistic expectations help aspiring traders maintain motivation throughout the learning process.
Basic concept understanding typically requires 3-6 months of consistent study. Order blocks, Fair Value Gaps, and market structure analysis form the foundation that supports advanced ICT concepts.
Setup identification skills develop over 6-12 months with regular practice and backtesting. Pattern recognition improves gradually through repetitive exposure to various market conditions.
Trade execution proficiency often requires 12-18 months of live trading experience. Emotional control and discipline development take longer than technical skill acquisition.
Consistent profitability may take 18-24 months or longer depending on dedication, practice quality, and individual learning rates. Prop firm success often occurs faster due to reduced capital pressure.
At Phidias, we’ve observed accelerated learning curves when traders focus exclusively on ICT methodology rather than mixing approaches. Dedicated focus produces faster results than scattered education.
Free vs Paid ICT Education Resources
ICT education resources range from free YouTube content to expensive private mentoring. Strategic resource selection helps optimize learning while managing costs effectively.
Michael Huddleston’s free YouTube channel provides comprehensive ICT education covering every major concept. This foundational resource offers sufficient information for serious students to develop profitability.
Free community resources including Discord servers, forums, and social media groups provide peer support and additional perspectives on ICT implementation. Community learning accelerates concept absorption.
Paid courses often provide structured learning paths and condensed information that can accelerate the education process. Quality varies significantly, so research is essential before investment.
Mentoring programs offer personalized guidance and feedback that can dramatically reduce learning time frames. Cost-benefit analysis should consider individual learning styles and budget constraints.
Practice resources like TradingView charts, backtesting software, and demo accounts provide essential tools for skill development. Tool investment often provides better returns than course purchases.
Practice Strategies and Backtesting
Practice quality determines ICT learning speed more than practice quantity. Systematic approaches to skill development produce superior results compared to random practice sessions.
Chart time analysis involves studying historical price action to identify ICT setups and understand market behavior patterns. Daily chart review builds pattern recognition skills systematically.
Paper trading allows ICT practice without financial risk while developing execution skills and emotional control. Realistic paper trading with proper position sizing provides valuable experience.
Backtesting methodology for ICT setups requires manual analysis since most concepts cannot be automated easily. Systematic backtesting provides statistical confidence in setup performance.
Forward testing with small positions helps transition from paper trading to live execution. Gradual size increases allow skill building while limiting downside risk.
Performance tracking during practice phases helps identify strengths and weaknesses in ICT application. Detailed records enable targeted improvement efforts for faster progress.
From Demo to Live Trading Timeline
Transition timing from demo to live trading depends on demonstrated consistency rather than arbitrary timeframes. Premature transitions often result in unnecessary losses and confidence damage.
Demo mastery indicators include consistent profitability over minimum 3-month periods, emotional stability during losing streaks, and setup identification accuracy above 60%.
Small account starting with limited risk helps bridge the psychological gap between demo and live trading. Position sizing should remain conservative during transition periods.
Psychological preparation for live trading involves accepting that real money will affect decision-making regardless of demo performance. Mental rehearsal helps prepare for emotional challenges.
Performance monitoring during early live trading helps identify deviations from demo performance. Immediate adjustments prevent minor issues from becoming major problems.
Gradual scaling allows position increases as live trading confidence and performance develop. Conservative growth prevents overconfidence from destroying accounts during early phases.
ICT Trading Tools and Platforms

Best Trading Platforms for ICT
Platform selection significantly impacts ICT trading effectiveness due to charting requirements and execution capabilities. Proper platform choice enhances analysis quality and trade execution precision.
TradingView provides excellent charting capabilities with ICT-friendly tools including easy level marking, multiple timeframe analysis, and comprehensive drawing tools. Professional subscriptions offer advanced features for serious ICT traders.
NinjaTrader excels for futures trading with professional charting and advanced order management. ICT concepts apply effectively across forex and futures markets using appropriate platforms.
At Phidias, we provide platform recommendations based on account types and trading preferences. You can use all Rithmic compatible platform to trade with us. Platform optimization can significantly improve ICT trading performance and efficiency.
Essential Indicators and Drawing Tools
ICT trading relies primarily on raw price action rather than traditional indicators. Minimal indicator usage maintains chart clarity while providing necessary analysis support tools.
Moving averages can help identify overall trend direction on higher timeframes without cluttering lower timeframe analysis. Simple or exponential averages work equally well for trend identification.
Volume indicators provide confirmation for displacement and breakout validity. Volume profile analysis helps identify significant price levels and institutional activity zones.
Fibonacci tools remain essential for OTE (Optimal Trade Entry) identification and retracement analysis. Automatic fibonacci tools can speed analysis while maintaining accuracy.
Drawing tools including horizontal lines, trend lines, and rectangles help mark important ICT levels like order blocks, Fair Value Gaps, and liquidity zones. Clean charting improves analysis quality.
Custom indicators for ICT concepts exist but should supplement rather than replace manual analysis. Understanding underlying concepts remains more important than automated identification.
Charting Setup and Workspace Organization
Workspace organization dramatically affects ICT analysis efficiency and accuracy. Systematic chart setup reduces analysis time while improving decision quality.
Multiple timeframe layouts allow simultaneous analysis of weekly, daily, 4-hour, and hourly charts. Synchronized scrolling helps understand relationships between timeframes.
Color coding for different ICT concepts helps visual organization. Order blocks, Fair Value Gaps, liquidity zones, and structure levels should use consistent colors across all charts.
Template creation ensures consistent chart appearance and tool availability across different instruments. Standardized templates reduce setup time and improve efficiency.
Alert configuration for key levels and potential setups helps monitor multiple instruments simultaneously. Mobile alerts ensure opportunity awareness during away periods.
Backup systems for chart setups and analysis prevent loss of important work. Cloud storage and regular backups protect months of preparation work.
Real ICT Trading Results and Case Studies
Statistics below are based on Inner Circle Trader shared information.
Before and After Performance Analysis
Performance characteristics through ICT adoption demonstrate the methodology’s potential when properly implemented by dedicated practitioners. Statistical analysis reveals specific changes in key trading metrics for committed students.
Win rate changes often show improvements from 35-45% with previous methods to 55-65% with proper ICT implementation. These changes may result from improved setup selection and enhanced market understanding.
Risk-reward characteristics can improve when traders develop better entry timing through ICT concepts. Average reward potential may increase from 1:1 to 1:2.5 or better with dedicated practice and proper implementation.
Monthly consistency may show improvement as ICT practitioners develop disciplined approaches and focus on structured trading periods. Consistent application can lead to more predictable performance patterns.
Drawdown characteristics often improve through enhanced risk management and setup selectivity. Maximum drawdowns may decrease by 30-50% compared to previous approaches when properly implemented.
Psychological metrics including confidence and decision quality often show improvement with systematic ICT approaches. Structured methodologies can reduce emotional decision-making and improve trading discipline.
ICT Trading Profitability Statistics
Statistical analysis of ICT trading performance provides insights into the methodology’s characteristics when properly implemented. Data-driven observations help set realistic expectations for traders considering this approach.
ICT Trading Performance Dashboard
Overall Success Metrics
| Metric | 6 Months | 12 Months | 18 Months | 24+ Months |
|---|---|---|---|---|
| Consistency Rate | 45% | 55% | 65% | 75% |
| Average Monthly Return | 3-5% | 5-8% | 8-12% | 10-15% |
| Maximum Drawdown | 15-25% | 12-20% | 8-15% | 5-12% |
| Risk-Adjusted Returns | 0.8-1.2 | 1.2-1.8 | 1.8-2.5 | 2.5-3.5 |
Setup-Specific Performance Analysis
| Setup Type | Win Rate | Average R:R | Frequency | Best Timeframes | Skill Level Required |
|---|---|---|---|---|---|
| Order Blocks | 70-75% | 1:1.5 | High | 4H, Daily | Beginner-Intermediate |
| Fair Value Gaps | 65-70% | 1:2 | Medium-High | 1H, 4H | Beginner-Intermediate |
| Liquidity Sweeps | 45-55% | 1:3+ | Medium | Daily, Weekly | Intermediate-Advanced |
| OTE Entries | 60-65% | 1:2.5 | Medium | 4H, Daily | Intermediate |
| Displacement Trades | 50-60% | 1:2.8 | Low-Medium | Daily, Weekly | Advanced |
Timeframe Performance Comparison
| Timeframe | Consistency | Frequency | Risk Level | Best For | Success Rate |
|---|---|---|---|---|---|
| 5-15 Minutes | Medium | Very High | High | Scalping | 55-60% |
| 1-4 Hours | High | High | Medium | Day Trading | 65-70% |
| Daily | Very High | Medium | Low-Medium | Swing Trading | 70-75% |
| Weekly | High | Low | Low | Position Trading | 65-70% |
Market Condition Performance
| Market Type | ICT Effectiveness | Best Strategies | Adaptation Required |
|---|---|---|---|
| Strong Trends | Excellent (75%+) | Structure breaks, OTE entries | Minimal |
| Range-bound | Good (60-65%) | Liquidity sweeps, Mean reversion | Moderate |
| High Volatility | Very Good (70%+) | Quick entries/exits, Tight stops | High |
| Low Volatility | Fair (50-55%) | Patient setups, Wider stops | High |
Experience-Based Progression
| Experience Level | Typical Results | Key Characteristics | Improvement Focus |
|---|---|---|---|
| 0-6 Months | Learning phase, 45% consistency | Concept absorption | Basic pattern recognition |
| 6-12 Months | Skill building, 55% consistency | Setup identification | Risk management |
| 12-18 Months | Competence development, 65% consistency | Trade execution | Psychology & discipline |
| 18+ Months | Mastery pursuit, 75% consistency | Consistent application | Advanced techniques |
Implementation success rates for dedicated ICT practitioners show that approximately 65% develop consistent profitability within 18 months of focused study. This reflects the methodology’s structured learning curve and systematic approach requirements.
Advanced ICT Trading Concepts
Multi-Timeframe Analysis Mastery
Multi-timeframe analysis represents advanced ICT skill that dramatically improves setup quality and trade timing. Systematic approaches to timeframe correlation prevent conflicting signals and improve consistency.
Weekly analysis provides macro structure and major targets for monthly trading objectives. Weekly order blocks and Fair Value Gaps often control price behavior for extended periods.
Daily structure offers primary direction and swing trading opportunities while providing context for lower timeframe entries. Daily displacement creates 4-hour and hourly trading opportunities.
4-hour timeframes bridge daily direction with intraday precision, offering intermediate-term trades ideal for prop firm requirements. 4-hour confluence with daily bias creates high-conviction setups.
Hourly analysis provides entry refinement and trade management guidance for higher timeframe setups. Hourly structure breaks often signal optimal entry timing for daily positions.
Timeframe hierarchy requires respecting higher timeframe bias while using lower timeframes for execution precision. Conflicting timeframes should prevent trade execution until alignment occurs.
Complex Market Structure Scenarios
Advanced market structure analysis involves understanding complex scenarios where simple rules may not apply directly. Pattern recognition and adaptive thinking become crucial for challenging conditions.
Double tops/bottoms require careful analysis to distinguish between genuine reversals and liquidity engineering. Volume, momentum, and institutional behavior provide additional confirmation beyond price patterns alone.
Consolidation breakouts present challenging scenarios where traditional ICT approaches may conflict. Time-based analysis and volatility compression help determine legitimate breakout potential.
News-driven movements can temporarily invalidate technical ICT setups while creating new opportunities. Fundamental awareness helps ICT traders adapt to changing market dynamics.
Correlation breakdowns during crisis periods require adaptive strategies when normal relationships fail. Individual instrument analysis becomes more important than correlation trading.
Holiday markets and low liquidity periods often distort normal ICT patterns. Reduced activity requires adjusted expectations and modified approaches for optimal results.
Combining ICT with Other Methodologies
ICT integration with complementary approaches can enhance overall trading effectiveness without compromising core methodology principles. Selective integration avoids signal conflicts while adding value.
Volume analysis provides excellent confirmation for ICT setups without contradicting core principles. Volume profile and order flow analysis enhance displacement and breakout validation.
Sentiment analysis helps understand broader market mood that influences institutional behavior. Fear/greed cycles affect ICT pattern development and trade outcomes.
Economic calendar awareness prevents ICT traders from being caught by fundamental surprises that override technical analysis. News filtering improves setup timing.
Seasonal patterns in currency and commodity markets provide additional context for ICT analysis. Cyclical behavior can enhance directional bias development.
Intermarket analysis using bonds, commodities, and equity relationships provides macro context for ICT setups. Correlation understanding improves trade selection.
ICT Trading Psychology and Mindset
Developing Patience for Quality Setups
Patience development represents perhaps the most challenging aspect of ICT trading mastery. Modern markets reward selective trading over active participation, requiring psychological adjustment for most traders.
Setup selectivity requires understanding that fewer, higher-quality trades produce better long-term results than frequent trading. ICT methodology naturally supports this approach through kill zone focus.
FOMO management (Fear of Missing Out) becomes crucial when obvious setups fail to materialize. Systematic approaches and predefined criteria help resist emotional urges to force trades.
Boredom tolerance during quiet periods separates successful ICT traders from failed attempts. Alternative activities like education and preparation provide productive uses of downtime.
Opportunity recognition improves naturally with experience, making patience easier as traders understand setup frequency and market cycles. Realistic expectations prevent premature abandon of methodology.
Reward systems for patient behavior help reinforce positive trading habits. Process-based rewards rather than outcome-based ones support long-term consistency.
Managing Emotions During Drawdowns
Drawdown management represents critical skill for long-term ICT success. Emotional stability during losing periods often determines whether traders survive to experience profitable phases.
Drawdown expectation helps psychological preparation for inevitable losing periods. Understanding that drawdowns are normal reduces emotional impact when they occur.
Position sizing adjustment during drawdowns prevents spiral effects that destroy accounts. Reduced sizing allows strategy continuation while limiting damage during difficult periods.
Process focus rather than outcome focus maintains ICT discipline during challenging times. Concentrating on setup quality and execution rather than profits improves decision-making.
Support systems including mentors, trading communities, and professional help provide emotional stability during extended drawdowns. Isolation during difficult periods worsens psychological pressure.
Recovery protocols with clear rules for returning to full position sizing help systematic approach to drawdown exit. Arbitrary decisions during emotional periods often extend difficult phases.
Building Confidence in ICT Signals
Confidence building in ICT signals requires systematic validation through backtesting, forward testing, and gradual live implementation. Rushed confidence often leads to overconfidence and subsequent losses.
Backtesting results provide statistical foundation for ICT confidence. Comprehensive testing across various market conditions helps understand setup performance characteristics.
Paper trading success builds confidence while avoiding financial risk. Extended paper trading periods help validate setup identification and execution skills.
Small position starting with live trading allows confidence building without significant risk. Gradual sizing increases match growing confidence and demonstrated competence.
Documentation of successful trades and setup analysis provides concrete evidence of ICT effectiveness. Trade journals help reinforce positive experiences during doubting periods.
Community support from other ICT traders provides validation and shared experiences. Isolation can undermine confidence even when trading is performing well.
Conclusion: Your Path to ICT Trading Understanding
ICT trading represents one comprehensive approach to understanding how modern markets may operate. By learning to analyze potential institutional behavior and recognize liquidity patterns, traders can develop a different perspective on market movements that many retail participants don’t typically consider.
The journey from ICT beginner to competent practitioner requires dedication, patience, and systematic study. Like any trading methodology, the learning process involves both intellectual understanding and practical application to develop genuine competence.
At Phidias, we support traders using various methodologies, including those who choose to incorporate ICT concepts into their trading approach. The methodology’s emphasis on structured analysis and disciplined decision-making can complement the systematic approach that many successful prop firm traders develop.
Your success with ICT trading depends on thorough education and consistent application of the principles outlined in this guide. Start with foundational concepts, practice systematically, and gradually develop your understanding. Remember that successful trading requires ongoing learning and skill refinement regardless of methodology.
The financial markets offer opportunities for traders who develop sound approaches and risk management skills. ICT trading provides one framework for understanding market dynamics while developing the discipline necessary for long-term success.
Interested in exploring ICT concepts as part of your trading education? This guide provides comprehensive information, but practical experience comes through application and practice. Consider starting your journey with a Phidias evaluation account where you can apply various trading approaches, including ICT concepts, in a supportive prop firm environment.
Frequently Asked Questions
What is ICT in trading?
ICT stands for Inner Circle Trading, a methodology developed by Michael J. Huddleston that focuses on understanding market movements from an institutional perspective. It teaches traders to recognize liquidity manipulation, market structure, and smart money behavior.
Does ICT trading work?
ICT trading has proven effective for many traders, particularly in prop firm environments. Success depends on proper education, consistent practice, and disciplined application of the methodology’s principles.
How long does it take to learn ICT trading?
Basic ICT concepts can be learned in 3-6 months, but consistent profitability typically requires 12-24 months of dedicated practice. Individual results vary based on study intensity and previous trading experience.
Is ICT better than price action?
ICT represents an evolution of traditional price action that accounts for modern market realities like algorithmic trading and institutional manipulation. It provides more accurate explanations for price behavior than classical technical analysis.
What’s the difference between ICT and SMC?
ICT (Inner Circle Trading) and SMC (Smart Money Concepts) are closely related but ICT provides more structured education and specific trade management rules. Both focus on institutional behavior but use different terminology.
Can beginners learn ICT trading?
Yes, beginners can learn ICT trading, but it requires significant dedication and systematic study. Starting with basic concepts like market structure and order blocks before advancing to complex topics improves success rates.
Ready to explore ICT concepts and develop your trading education? This comprehensive guide provides the framework, and practical application comes through dedicated practice. Consider starting your learning journey with a Phidias evaluation account where you can apply various trading methodologies, including ICT concepts, in a supportive prop firm environment.