Summary: Trading indicators are calculations plotted on a chart that help you read momentum, trend, volatility and volume. The main families are trend indicators like moving averages, momentum indicators like RSI and MACD, volatility indicators like Bollinger Bands, and volume indicators. No indicator predicts the future, they organize past price into signals you can act on. This guide explains what indicators are, the essential types, how to use them without cluttering your chart, and how funded futures traders with Phidias Propfirm combine a few indicators with strict risk control.
Open any trading platform and you will find hundreds of indicators. The good news is you only need to understand a handful. Here is what indicators are, the types that matter, and how to use them well.
What is a trading indicator?
A trading indicator is a mathematical calculation based on price, volume or both, plotted on or below your chart. Indicators translate raw price into a clearer signal, for example smoothing a trend or measuring whether a move is overextended. They do not predict the future. They summarize what price has already done so you can make a more informed decision, and they work best as confirmation, not as a crystal ball.
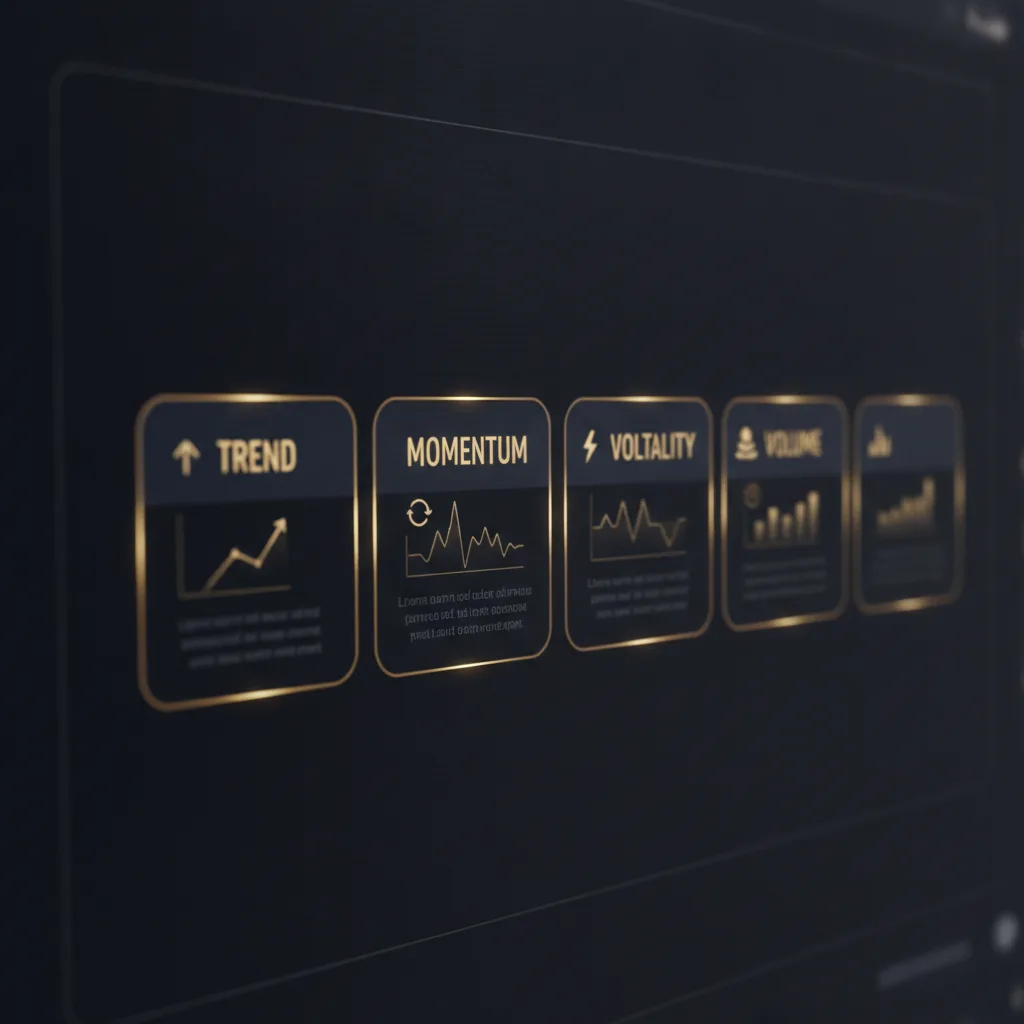
The main types of indicators
- Trend indicators. Moving averages and the like show the direction and strength of a trend, helping you trade with the flow rather than against it.
- Momentum indicators. The RSI and MACD measure the speed of price moves and whether a market is overbought or oversold.
- Volatility indicators. Bollinger Bands and the ATR show how much price is moving, useful for sizing stops and spotting quiet or explosive conditions.
- Volume indicators. These gauge participation behind a move, since a breakout on strong volume is more convincing than one on thin volume.
Most strategies combine one or two families, for example a trend indicator to pick direction and a momentum indicator to time entries.
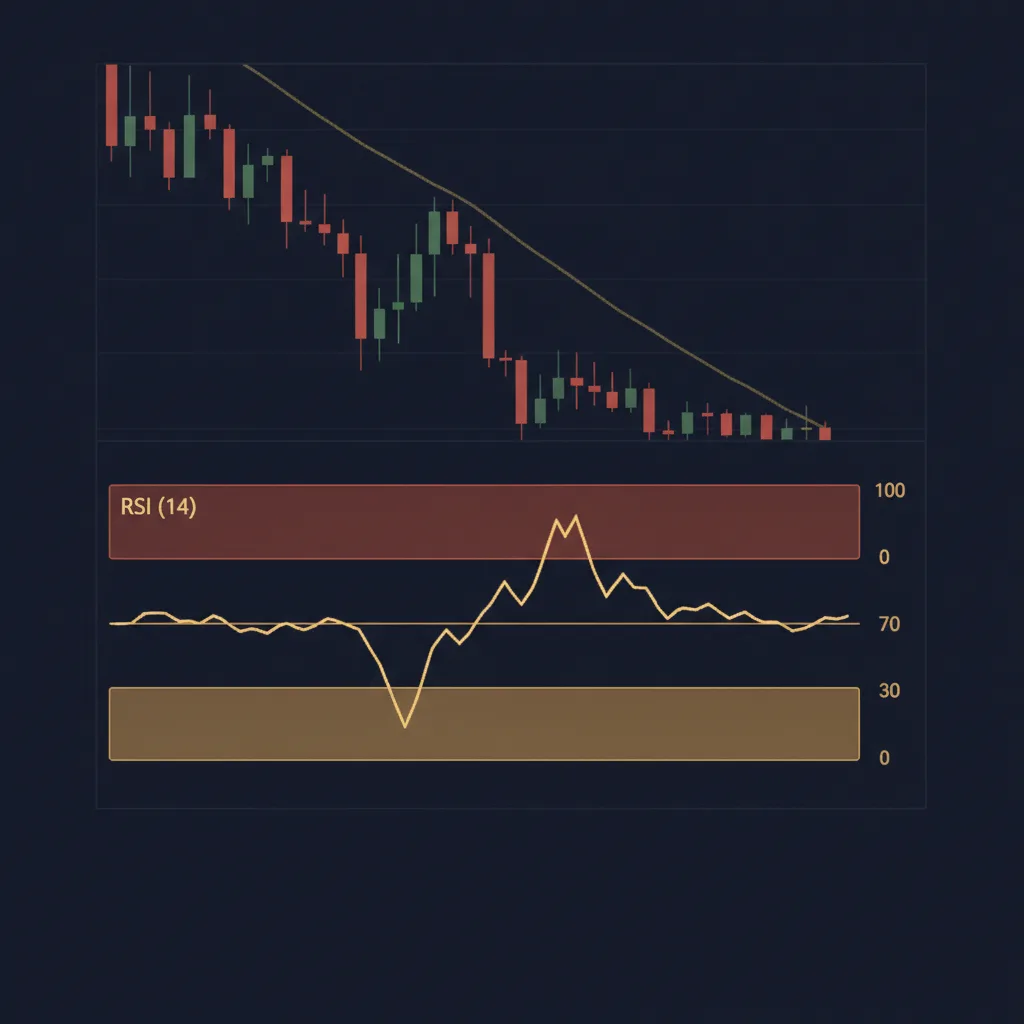
Leading versus lagging indicators
Lagging indicators, like moving averages, confirm a move after it starts and are reliable but late. Leading indicators, like some momentum oscillators, try to anticipate turns and are earlier but give more false signals. There is no free lunch: earlier means noisier. Good traders accept this trade-off and use indicators to confirm a plan, not to replace one.
How to use indicators without cluttering your chart
The most common beginner mistake is stacking a dozen indicators until they contradict each other. Two or three that you understand deeply beat ten you half read. Pick one for trend, one for momentum, and let price action lead. Combine them with core tools like support and resistance, covered in our support and resistance indicator guide. Simplicity and consistency win.
Indicators are a tool, risk control is the edge
Even the best indicator setup loses money without risk management. Indicators help you find and time trades, but position sizing and stops decide whether you survive. This is why funded traders pair a simple, tested indicator approach with strict rules on how much they risk per trade.
Take action with Phidias Propfirm
Have a tested, indicator-based edge? Apply it to funded capital. With Phidias Propfirm you pass an evaluation and trade the firm’s futures capital, keeping up to 100% of the profit. Phidias was built on a simple idea: we profit when you go LIVE, not when you fail. A static or end of day drawdown with no hidden buffer, news trading on every account, overnight and weekend holding on Premium, and real live capital through Dorman Trading. Selective rules, never punitive, and payouts that are never refused. Compare options in our best futures prop firms guide, start with an affordable funded account, or read our best indicators for day trading guide.
Frequently Asked Questions
What are indicators in trading?
Indicators are calculations based on price or volume plotted on a chart to reveal trend, momentum, volatility or volume. They organize past price into clearer signals but do not predict the future.
What are the main types of trading indicators?
The four families are trend indicators like moving averages, momentum indicators like RSI and MACD, volatility indicators like Bollinger Bands, and volume indicators. Most strategies combine one or two.
What is the difference between leading and lagging indicators?
Lagging indicators confirm a move after it starts and are reliable but late; leading indicators try to anticipate turns and are earlier but noisier. Each involves a trade-off between speed and accuracy.
How many indicators should I use?
Two or three you understand deeply are enough. Stacking many indicators leads to conflicting signals and analysis paralysis. Combine a trend and a momentum tool with price action.
Do indicators actually work?
They work as confirmation within a tested plan and with strict risk management, but not as standalone predictors. The edge comes from how you combine them with risk control, not from any single indicator.